Navigation
Install the app
How to install the app on iOS
Follow along with the video below to see how to install our site as a web app on your home screen.

Note: This feature currently requires accessing the site using the built-in Safari browser.
More options
You are using an out of date browser. It may not display this or other websites correctly.
You should upgrade or use an alternative browser.
You should upgrade or use an alternative browser.
Right wingers dont appreciate competitive open markets
- Thread starter Supposn
- Start date

FALSE. Real GDP set a new historical record high by 1936, and increased from there. By ANY form of measure, FDR and the New Deal was a HUGE success.
Everyone is entitled to his own opinion, but not his own facts.
Daniel Patrick Moynihan
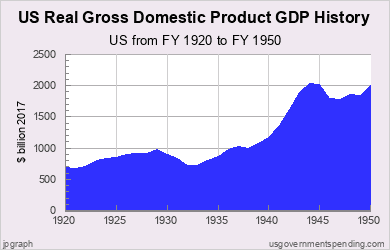
False. Check out 1929, real GDP was 103.6 billion. That GDP was not exceeded until 1941, as I said. As for ANY form of measure, how about unemployment. You really want to claim that the New Deal was a HUGE success based on that? Aside from the GDP numbers, which was also anything but a HUGE success.
Year GDP US Billion
1929 103.6
1930 91.2
1931 76.5
1932 58.7
1933 56.4
1934 66
1935 73.3
1936 83.8
1937 91.9
1938 86.1
1939 92.2
1940 101.4
1941 126.7
Government Spending Chart in United States 1920-2010 - Federal State Local
Here is a chart from your site.
Growth in GDP is what matters, and the U.S. GDP growth has historically averaged about 2.5-3% per year but with substantial deviations.
The GDP numbers are reported in two forms: current dollar and constant dollar. Current dollar GDP is calculated using today's dollars and makes comparisons between time periods difficult because of the effects of inflation. Constant dollar GDP solves this problem by converting the current information into some standard era dollar, such as 1997 (2005) dollars. This process factors out the effects of inflation and allows easy comparisons between periods.
Yes, FDR and the New Deal were a HUGE success.
Top Five Years for GDP Expansion:
1942, +18.5%
1941, +17.1%
1943, +16.4%
1936, +13.0%
1934, +10.9%
Top Five Years for GDP Contraction:
1932, -13.1%
1946, -10.9%
1930, -8.6%
1931, -6.5%
2009, -3.5%
I already addressed unemployment...maybe you missed it...
The greatest yearly increase in GDP occurred during the New Deal, AND, the LARGEST DROP IN UNEPLOYMENT in America history occurred during the New Deal...
Census document HS-29 (available in PDF). Quoting directly from Census data, here are the unemployment rates and total number of official unemployed at the beginning and end of the presidential terms since the Great Depression:
ROOSEVELT PRE-WWII NEW DEAL
1932 Unemployment Rate: 23.6% (12.8 million total unemployed)
1940 Unemployment Rate: 14.6% (8.1 million total unemployed)
Unemployment Rate Change: -9.0
Total unemployment percentage change: -36.7%
ROOSEVELT WWII
1941 Unemployment Rate: 9.9% (5.5 million total unemployed)
1944 Unemployment Rate: 1.2% (670,000 total unemployed)
Unemployment Rate Change: -8.7
Total unemployment percentage change: -87.9%
TRUMAN
1945 Unemployment Rate: 1.9% (1.0 million total unemployed)
1952 Unemployment Rate: 3.0% (1.8 million total unemployed)
Unemployment Rate Change: +1.1
Total unemployment percentage change: +81.0%
EISENHOWER
1953 Unemployment Rate: 2.9% (1.8 million total unemployed)
1960 Unemployment Rate: 5.5% (3.8 million total unemployed)
Unemployment Rate Change: +2.6%
Total unemployment percentage change: +110.03%
KENNEDY
1961 Unemployment Rate: 6.7% (4.7 million total unemployed)
1963 Unemployment Rate: 5.7% (4.0 million total unemployed)
Unemployment Rate Change: -1.0%
Total unemployment percentage change: -13.6%
JOHNSON
1964 Unemployment Rate: 5.2% (3.7 million total unemployed)
1968 Unemployment Rate: 3.6% (2.8 million total unemployed)
Unemployment Rate Change: -1.6%
Total unemployment percentage change: -25.6%
NIXON
1969 Unemployment Rate: 3.5% (2.8 million total unemployed)
1974 Unemployment Rate: 5.6% (5.1 million total unemployed)
Unemployment Rate Change: +2.1%
Total unemployment percentage change: +82.0%
FORD
1975 Unemployment Rate: 8.5% (7.9 million total unemployed)
1976 Unemployment Rate: 7.7% (7.4 million total unemployed)
Unemployment Rate Change: -0.8%
Total unemployment percentage change: -6.6%
CARTER
1977 Unemployment Rate: 7.1% (6.9 million total unemployed)
1980 Unemployment Rate: 7.1% (7.6 million total unemployed)
Unemployment Rate Change: 0.0
Total unemployment percentage change: +9.24%
REAGAN
1981 Unemployment Rate: 7.6% (8.2 million total unemployed)
1988 Unemployment Rate: 5.5% (6.7 million total unemployed)
Unemployment Rate Change: -2.1%
Total unemployment percentage change: -19.0%
BUSH I
1989 Unemployment Rate: 5.3% (6.5 million total unemployed)
1992 Unemployment Rate: 7.5% (9.6 million total unemployed)
Unemployment Rate Change: +2.2
Total unemployment percentage change: +47.2%
CLINTON
1993 Unemployment Rate: 6.9% (8.9 million total unemployed)
2000 Unemployment Rate: 4.0% (5.6 million total unemployed)
Unemployment Rate Change -2.9
Total unemployment percentage change: -36.3%
As you can see, in terms of the unemployment rate - that is, the percentage of the total workforce not working - the pre-WWII New Deal era saw the single largest drop in American history. Yes, I'll say that again for conservatives, just to make sure they get it: The PRE-WWII New Deal era from 1933-1940 - not the WWII era - saw the largest drop in the unemployment rate in American history. And by the way, that even includes the recession of 1937-1938.
Now, it is certainly true that the percentage drop of total unemployed was bigger in WWII than it was in the pre-WWII New Deal era. But as the data show, even by that metric, the pre-WWII New Deal era saw the second largest percentage drop in total unemployed in the 20th century, going from 12.8 million unemployed in Roosevelt's first year in office to 8.1 million unemployed at the end of his second term in 1940. That's a 36.7 percent drop - larger than the Clinton era (36.3%) and, yes conservatives, larger than the Reagan era (a mere 19%). At the absolute minimum, that would suggests the New Deal was a positive - not negative - economic force (and empirically more positive than, say, Reagan's free-market agenda).
These are the hard and fast numbers conservatives would like us all to forget with their claim that history proves massive spending packages like the New Deal will supposedly harm our economy.
The Forgotten Math: Pre-WWII New Deal Saw Biggest Drop In Unemployment Rate in American History
And you keep forgetting that your right wing austerity approach doesn't work. FDR found that out. FDR had his own right wing regressives to contend with, HERE is where that led.
The Recession of 19371938 was a temporary reversal of the pre-war 1933 to 1941 economic recovery from the Great Depression in the United States. Economists disagree about the causes of this downturn, but agree that government austerity reversed the recovery. wiki
AUSTERITY? In 1937? LOL, I don't think so.
Bfgrn
Gold Member
- Apr 4, 2009
- 16,829
- 2,492
- 245
False. Check out 1929, real GDP was 103.6 billion. That GDP was not exceeded until 1941, as I said. As for ANY form of measure, how about unemployment. You really want to claim that the New Deal was a HUGE success based on that? Aside from the GDP numbers, which was also anything but a HUGE success.
Year GDP US Billion
1929 103.6
1930 91.2
1931 76.5
1932 58.7
1933 56.4
1934 66
1935 73.3
1936 83.8
1937 91.9
1938 86.1
1939 92.2
1940 101.4
1941 126.7
Government Spending Chart in United States 1920-2010 - Federal State Local
Here is a chart from your site.
Growth in GDP is what matters, and the U.S. GDP growth has historically averaged about 2.5-3% per year but with substantial deviations.
The GDP numbers are reported in two forms: current dollar and constant dollar. Current dollar GDP is calculated using today's dollars and makes comparisons between time periods difficult because of the effects of inflation. Constant dollar GDP solves this problem by converting the current information into some standard era dollar, such as 1997 (2005) dollars. This process factors out the effects of inflation and allows easy comparisons between periods.
Yes, FDR and the New Deal were a HUGE success.
Top Five Years for GDP Expansion:
1942, +18.5%
1941, +17.1%
1943, +16.4%
1936, +13.0%
1934, +10.9%
Top Five Years for GDP Contraction:
1932, -13.1%
1946, -10.9%
1930, -8.6%
1931, -6.5%
2009, -3.5%
I already addressed unemployment...maybe you missed it...
The greatest yearly increase in GDP occurred during the New Deal, AND, the LARGEST DROP IN UNEPLOYMENT in America history occurred during the New Deal...
Census document HS-29 (available in PDF). Quoting directly from Census data, here are the unemployment rates and total number of official unemployed at the beginning and end of the presidential terms since the Great Depression:
ROOSEVELT PRE-WWII NEW DEAL
1932 Unemployment Rate: 23.6% (12.8 million total unemployed)
1940 Unemployment Rate: 14.6% (8.1 million total unemployed)
Unemployment Rate Change: -9.0
Total unemployment percentage change: -36.7%
ROOSEVELT WWII
1941 Unemployment Rate: 9.9% (5.5 million total unemployed)
1944 Unemployment Rate: 1.2% (670,000 total unemployed)
Unemployment Rate Change: -8.7
Total unemployment percentage change: -87.9%
TRUMAN
1945 Unemployment Rate: 1.9% (1.0 million total unemployed)
1952 Unemployment Rate: 3.0% (1.8 million total unemployed)
Unemployment Rate Change: +1.1
Total unemployment percentage change: +81.0%
EISENHOWER
1953 Unemployment Rate: 2.9% (1.8 million total unemployed)
1960 Unemployment Rate: 5.5% (3.8 million total unemployed)
Unemployment Rate Change: +2.6%
Total unemployment percentage change: +110.03%
KENNEDY
1961 Unemployment Rate: 6.7% (4.7 million total unemployed)
1963 Unemployment Rate: 5.7% (4.0 million total unemployed)
Unemployment Rate Change: -1.0%
Total unemployment percentage change: -13.6%
JOHNSON
1964 Unemployment Rate: 5.2% (3.7 million total unemployed)
1968 Unemployment Rate: 3.6% (2.8 million total unemployed)
Unemployment Rate Change: -1.6%
Total unemployment percentage change: -25.6%
NIXON
1969 Unemployment Rate: 3.5% (2.8 million total unemployed)
1974 Unemployment Rate: 5.6% (5.1 million total unemployed)
Unemployment Rate Change: +2.1%
Total unemployment percentage change: +82.0%
FORD
1975 Unemployment Rate: 8.5% (7.9 million total unemployed)
1976 Unemployment Rate: 7.7% (7.4 million total unemployed)
Unemployment Rate Change: -0.8%
Total unemployment percentage change: -6.6%
CARTER
1977 Unemployment Rate: 7.1% (6.9 million total unemployed)
1980 Unemployment Rate: 7.1% (7.6 million total unemployed)
Unemployment Rate Change: 0.0
Total unemployment percentage change: +9.24%
REAGAN
1981 Unemployment Rate: 7.6% (8.2 million total unemployed)
1988 Unemployment Rate: 5.5% (6.7 million total unemployed)
Unemployment Rate Change: -2.1%
Total unemployment percentage change: -19.0%
BUSH I
1989 Unemployment Rate: 5.3% (6.5 million total unemployed)
1992 Unemployment Rate: 7.5% (9.6 million total unemployed)
Unemployment Rate Change: +2.2
Total unemployment percentage change: +47.2%
CLINTON
1993 Unemployment Rate: 6.9% (8.9 million total unemployed)
2000 Unemployment Rate: 4.0% (5.6 million total unemployed)
Unemployment Rate Change -2.9
Total unemployment percentage change: -36.3%
As you can see, in terms of the unemployment rate - that is, the percentage of the total workforce not working - the pre-WWII New Deal era saw the single largest drop in American history. Yes, I'll say that again for conservatives, just to make sure they get it: The PRE-WWII New Deal era from 1933-1940 - not the WWII era - saw the largest drop in the unemployment rate in American history. And by the way, that even includes the recession of 1937-1938.
Now, it is certainly true that the percentage drop of total unemployed was bigger in WWII than it was in the pre-WWII New Deal era. But as the data show, even by that metric, the pre-WWII New Deal era saw the second largest percentage drop in total unemployed in the 20th century, going from 12.8 million unemployed in Roosevelt's first year in office to 8.1 million unemployed at the end of his second term in 1940. That's a 36.7 percent drop - larger than the Clinton era (36.3%) and, yes conservatives, larger than the Reagan era (a mere 19%). At the absolute minimum, that would suggests the New Deal was a positive - not negative - economic force (and empirically more positive than, say, Reagan's free-market agenda).
These are the hard and fast numbers conservatives would like us all to forget with their claim that history proves massive spending packages like the New Deal will supposedly harm our economy.
The Forgotten Math: Pre-WWII New Deal Saw Biggest Drop In Unemployment Rate in American History
And you keep forgetting that your right wing austerity approach doesn't work. FDR found that out. FDR had his own right wing regressives to contend with, HERE is where that led.
The Recession of 19371938 was a temporary reversal of the pre-war 1933 to 1941 economic recovery from the Great Depression in the United States. Economists disagree about the causes of this downturn, but agree that government austerity reversed the recovery. wiki
AUSTERITY? In 1937? LOL, I don't think so.
The Recession of 19371938 was a temporary reversal of the pre-war 1933 to 1941 economic recovery from the Great Depression in the United States.
Background
By the spring of 1937, production, profits, and wages had regained their 1929 levels. Unemployment remained high, but it was considerably lower than the 25% rate seen in 1933. In June 1937, some of Roosevelt's advisors urged spending cuts to balance the budget. WPA rolls were drastically cut and PWA projects were slowed to a standstill. The American economy took a sharp downturn in mid-1937, lasting for 13 months through most of 1938. Industrial production declined almost 30 per cent and production of durable goods fell even faster. wiki
FDR cut spending by about 4% in 1937 and again in 1938, only a lefty can call that drastic cuts.
FED
YEAR GDP SPNDING DEBT
1936 83.8 9.17 a 53.25
1937 91.9 8.81 i 55.88 i
1938 86.1 8.45 a 56.61 a
1939 92.2 9.26 i 60.30 i
(billions)
FED
YEAR GDP SPNDING DEBT
1936 83.8 9.17 a 53.25
1937 91.9 8.81 i 55.88 i
1938 86.1 8.45 a 56.61 a
1939 92.2 9.26 i 60.30 i
(billions)
Bfgrn
Gold Member
- Apr 4, 2009
- 16,829
- 2,492
- 245
FDR cut spending by about 4% in 1937 and again in 1938, only a lefty can call that drastic cuts.
FED
YEAR GDP SPNDING DEBT
1936 83.8 9.17 a 53.25
1937 91.9 8.81 i 55.88 i
1938 86.1 8.45 a 56.61 a
1939 92.2 9.26 i 60.30 i
(billions)
I never called them drastic, YOU did. But the results were pretty drastic, weren't they? Isn't results how me measure success or failure? In the context of what was going on in the rest of the world, Franklin Delano Roosevelt saved capitalism. The rest of the world drifted into fascism. In America, there was a fascist plot to overthrow Roosevelt and there were strong socialist groups that were gaining power. General Smedley Butler exposed the coup plot before a Congressional committee hearing and FDR defused the socialists.
FDR was not a a "tax-and-spend" liberal, Roosevelt was in fact deeply committed to a balanced budget. He presented Congress with the Economy Act, a bill that put the federal government on a spending diet by cutting the salaries of federal employees, scaling back defense spending, and reducing veterans' pensions.
FDR was the epitome of a tax and spend liberal democrat.
snippet from the link below:
New Deal programs were financed by tripling federal taxes from $1.6 billion in 1933 to $5.3 billion in 1940. Excise taxes, personal income taxes, inheritance taxes, corporate income taxes, holding company taxes and so-called "excess profits" taxes all went up.
The most important source of New Deal revenue were excise taxes levied on alcoholic beverages, cigarettes, matches, candy, chewing gum, margarine, fruit juice, soft drinks, cars, tires (including tires on wheelchairs), telephone calls, movie tickets, playing cards, electricity, radios -- these and many other everyday things were subject to New Deal excise taxes, which meant that the New Deal was substantially financed by the middle class and poor people. Yes, to hear FDR's "Fireside Chats," one had to pay FDR excise taxes for a radio and electricity! A Treasury Department report acknowledged that excise taxes "often fell disproportionately on the less affluent."
Until 1937, New Deal revenue from excise taxes exceeded the combined revenue from both personal income taxes and corporate income taxes. It wasn't until 1942, in the midst of World War II, that income taxes exceeded excise taxes for the first time under FDR. Consumers had less money to spend, and employers had less money for growth and jobs.
New Deal taxes were major job destroyers during the 1930s, prolonging unemployment that averaged 17%. Higher business taxes meant that employers had less money for growth and jobs. Social Security excise taxes on payrolls made it more expensive for employers to hire people, which discouraged hiring.
Other New Deal programs destroyed jobs, too. For example, the National Industrial Recovery Act (1933) cut back production and forced wages above market levels, making it more expensive for employers to hire people - blacks alone were estimated to have lost some 500,000 jobs because of the National Industrial Recovery Act. The Agricultural Adjustment Act (1933) cut back farm production and devastated black tenant farmers who needed work. The National Labor Relations Act (1935) gave unions monopoly bargaining power in workplaces and led to violent strikes and compulsory unionization of mass production industries. Unions secured above-market wages, triggering big layoffs and helping to usher in the depression of 1938.
What about the good supposedly done by New Deal spending programs? These didn't increase the number of jobs in the economy, because the money spent on New Deal projects came from taxpayers who consequently had less money to spend on food, coats, cars, books and other things that would have stimulated the economy. This is a classic case of the seen versus the unseen -- we can see the jobs created by New Deal spending, but we cannot see jobs destroyed by New Deal taxing.
For defenders of the New Deal, perhaps the most embarrassing revelation about New Deal spending programs is they channeled money AWAY from the South, the poorest region in the United States. The largest share of New Deal spending and loan programs went to political "swing" states in the West and East - where incomes were at least 60% higher than in the South. As an incumbent, FDR didn't see any point giving much money to the South where voters were already overwhelmingly on his side.
Americans needed bargains, but FDR hammered consumers -- and millions had little money. His National Industrial Recovery Act forced consumers to pay above-market prices for goods and services, and the Agricultural Adjustment Act forced Americans to pay more for food. Moreover, FDR banned discounting by signing the Anti-Chain Store Act (1936) and the Retail Price Maintenance Act (1937).
Poor people suffered from other high-minded New Deal policies like the Tennessee Valley Authority monopoly. Its dams flooded an estimated 750,000 acres, an area about the size of Rhode Island, and TVA agents dispossessed thousands of people. Poor black sharecroppers, who didn't own property, got no compensation.
FDR might not have intended to harm millions of poor people, but that's what happened. We should evaluate government policies according to their actual consequences, not their good intentions.
How FDR's New Deal Harmed Millions of Poor People | Jim Powell | Cato Institute: Daily Commentary
Similar threads
- Replies
- 11
- Views
- 140
- Replies
- 68
- Views
- 758
- Replies
- 13
- Views
- 417
- Replies
- 5
- Views
- 189
Latest Discussions
- Replies
- 95
- Views
- 929
- Replies
- 2K
- Views
- 67K
- Replies
- 0
- Views
- 1
- Replies
- 3K
- Views
- 82K
Forum List
-
-
-
-
-
Political Satire 8029
-
-
-
-
-
-
-
-
-
-
-
-
-
-
-
-
-
-
-
ObamaCare 781
-
-
-
-
-
-
-
-
-
-
-
Member Usernotes 468
-
-
-
-
-
-
-
-
-
-