So we all see the graph where it shows cyclical CO2 patterns, and then it goes off the chart...realize those cyclical CO2 patterns are cycles of about 100,000 years.
Here is an example:
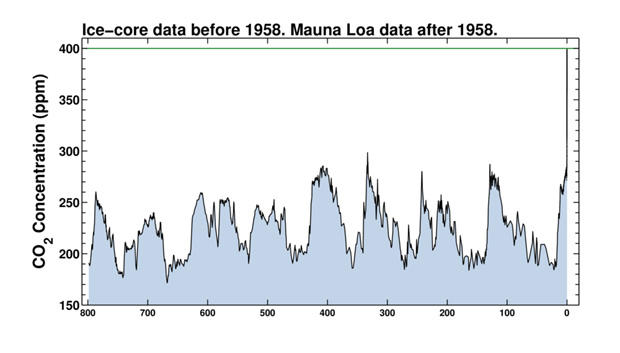
Really pause and think for a moment....
At the rate the CO2 is climbing, in just ONE of the past cycles, we would have over 200,000ppm CO2 in the Atmosphere.
That's 20% CO2 concentration in the atmosphere. Which will kill ALL life on Earth. Even plants can't "Breathe" in an atmosphere with that much CO2.
That's how much CO2 we are pumping into the atmosphere, that's how bad it is.
And Republicans simply say this is not a problem, this can continue, indefinitely.
They clearly think we can, or else they would acknowledge that it is a poison and we must STOP.
Here is an example:
Really pause and think for a moment....
At the rate the CO2 is climbing, in just ONE of the past cycles, we would have over 200,000ppm CO2 in the Atmosphere.
That's 20% CO2 concentration in the atmosphere. Which will kill ALL life on Earth. Even plants can't "Breathe" in an atmosphere with that much CO2.
That's how much CO2 we are pumping into the atmosphere, that's how bad it is.
And Republicans simply say this is not a problem, this can continue, indefinitely.
They clearly think we can, or else they would acknowledge that it is a poison and we must STOP.