Do you deny Arctic ice extents are dropping? Do you deny Arctic ice mass is dropping? And it is doing so most dramatically during the period you folks keep telling us proves that global warming has ended and that (your buddies say) CO2 has no effect on temperature.
Navigation
Install the app
How to install the app on iOS
Follow along with the video below to see how to install our site as a web app on your home screen.

Note: This feature currently requires accessing the site using the built-in Safari browser.
More options
You are using an out of date browser. It may not display this or other websites correctly.
You should upgrade or use an alternative browser.
You should upgrade or use an alternative browser.
Post the Experiment
- Thread starter jc456
- Start date
Do you deny Arctic ice extents are dropping? Do you deny Arctic ice mass is dropping? And it is doing so most dramatically during the period you folks keep telling us proves that global warming has ended and that (your buddies say) CO2 has no effect on temperature.
hahahaha, crick is at it again. he implies that I deny arctic ice extent is dropping but he neglects to quote what I said.
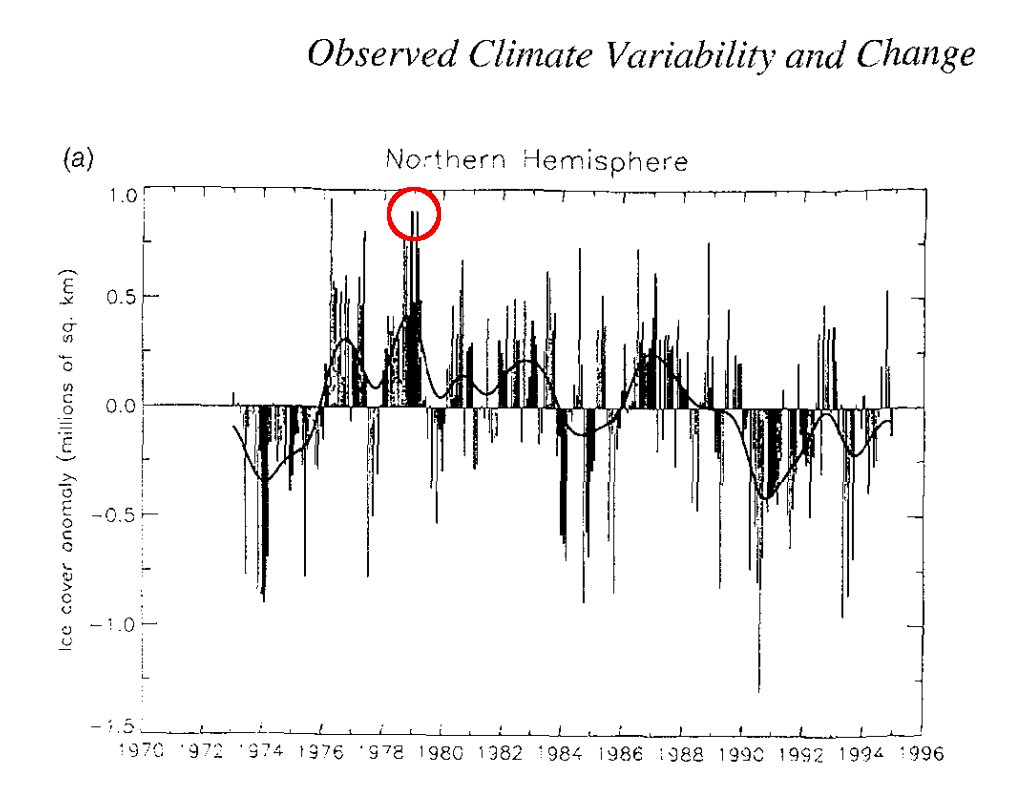
has arctic sea ice extent dropped from the high point in 1979? yes, both the average max and min have declined.. does this graph look like a death spiral? no. it would look even less like one with the extra four years of data added.
he finds it easier to argue with strawmen that only exist in his fevered imagination.
and if we had full satellite coverage from 1974 instead of 1979 then it would show an upturn before the downturn
graph from IPCC FAR
Old Rocks
Diamond Member
Well now, Ian, were you to average out that graph, and then do a best fit curve, that curve would not be linear, it would be a curve downward, in other word, a curve with increasing tangental slope down, in effect, a death spiral.Now Ian, you are engaged in lying. No, not going to fry us, going to make things a bit unpleasant.Wei, I'm not asking for that exactly. I'm referring to surface warming not atmospheric warming.I call you a liar because that's what you are.
A fraud and a liar, a jihadist member of a sick death worshiping cult.
I've asked you to show the relationship between CO2 and temperature and you show charts with no temperature axis, which tells me you're a liar, for claiming you successfully posted said chart, and a moron
With "Agrees" from jc456, BillyBoy and Political Chic. So we have four people - one of whom claims to be working on a doctorate in meteorology - who demand an experiment showing how CO2 causes heating of the atmosphere. But when shown the absorption spectra of CO2: spectral radiance vs wavelength, insist they have not been given what they demanded. Billy Boy, why don't you explain the problem to one of your professors and ask him if he knows how to get the information out of me.
yup. a few years ago it was all about surface warming from the near 50% of CO2 radiation being bounced back. and then 50% of that, and 50%...... 1 + 1/2 +1/4 +1/8....= 2 . CO2 had magically doubled the energy and was going to fry us all. you dont hear that too much anymore. where is konrad?
Arctic Sea Ice News and Analysis Sea ice data updated daily with one-day lag
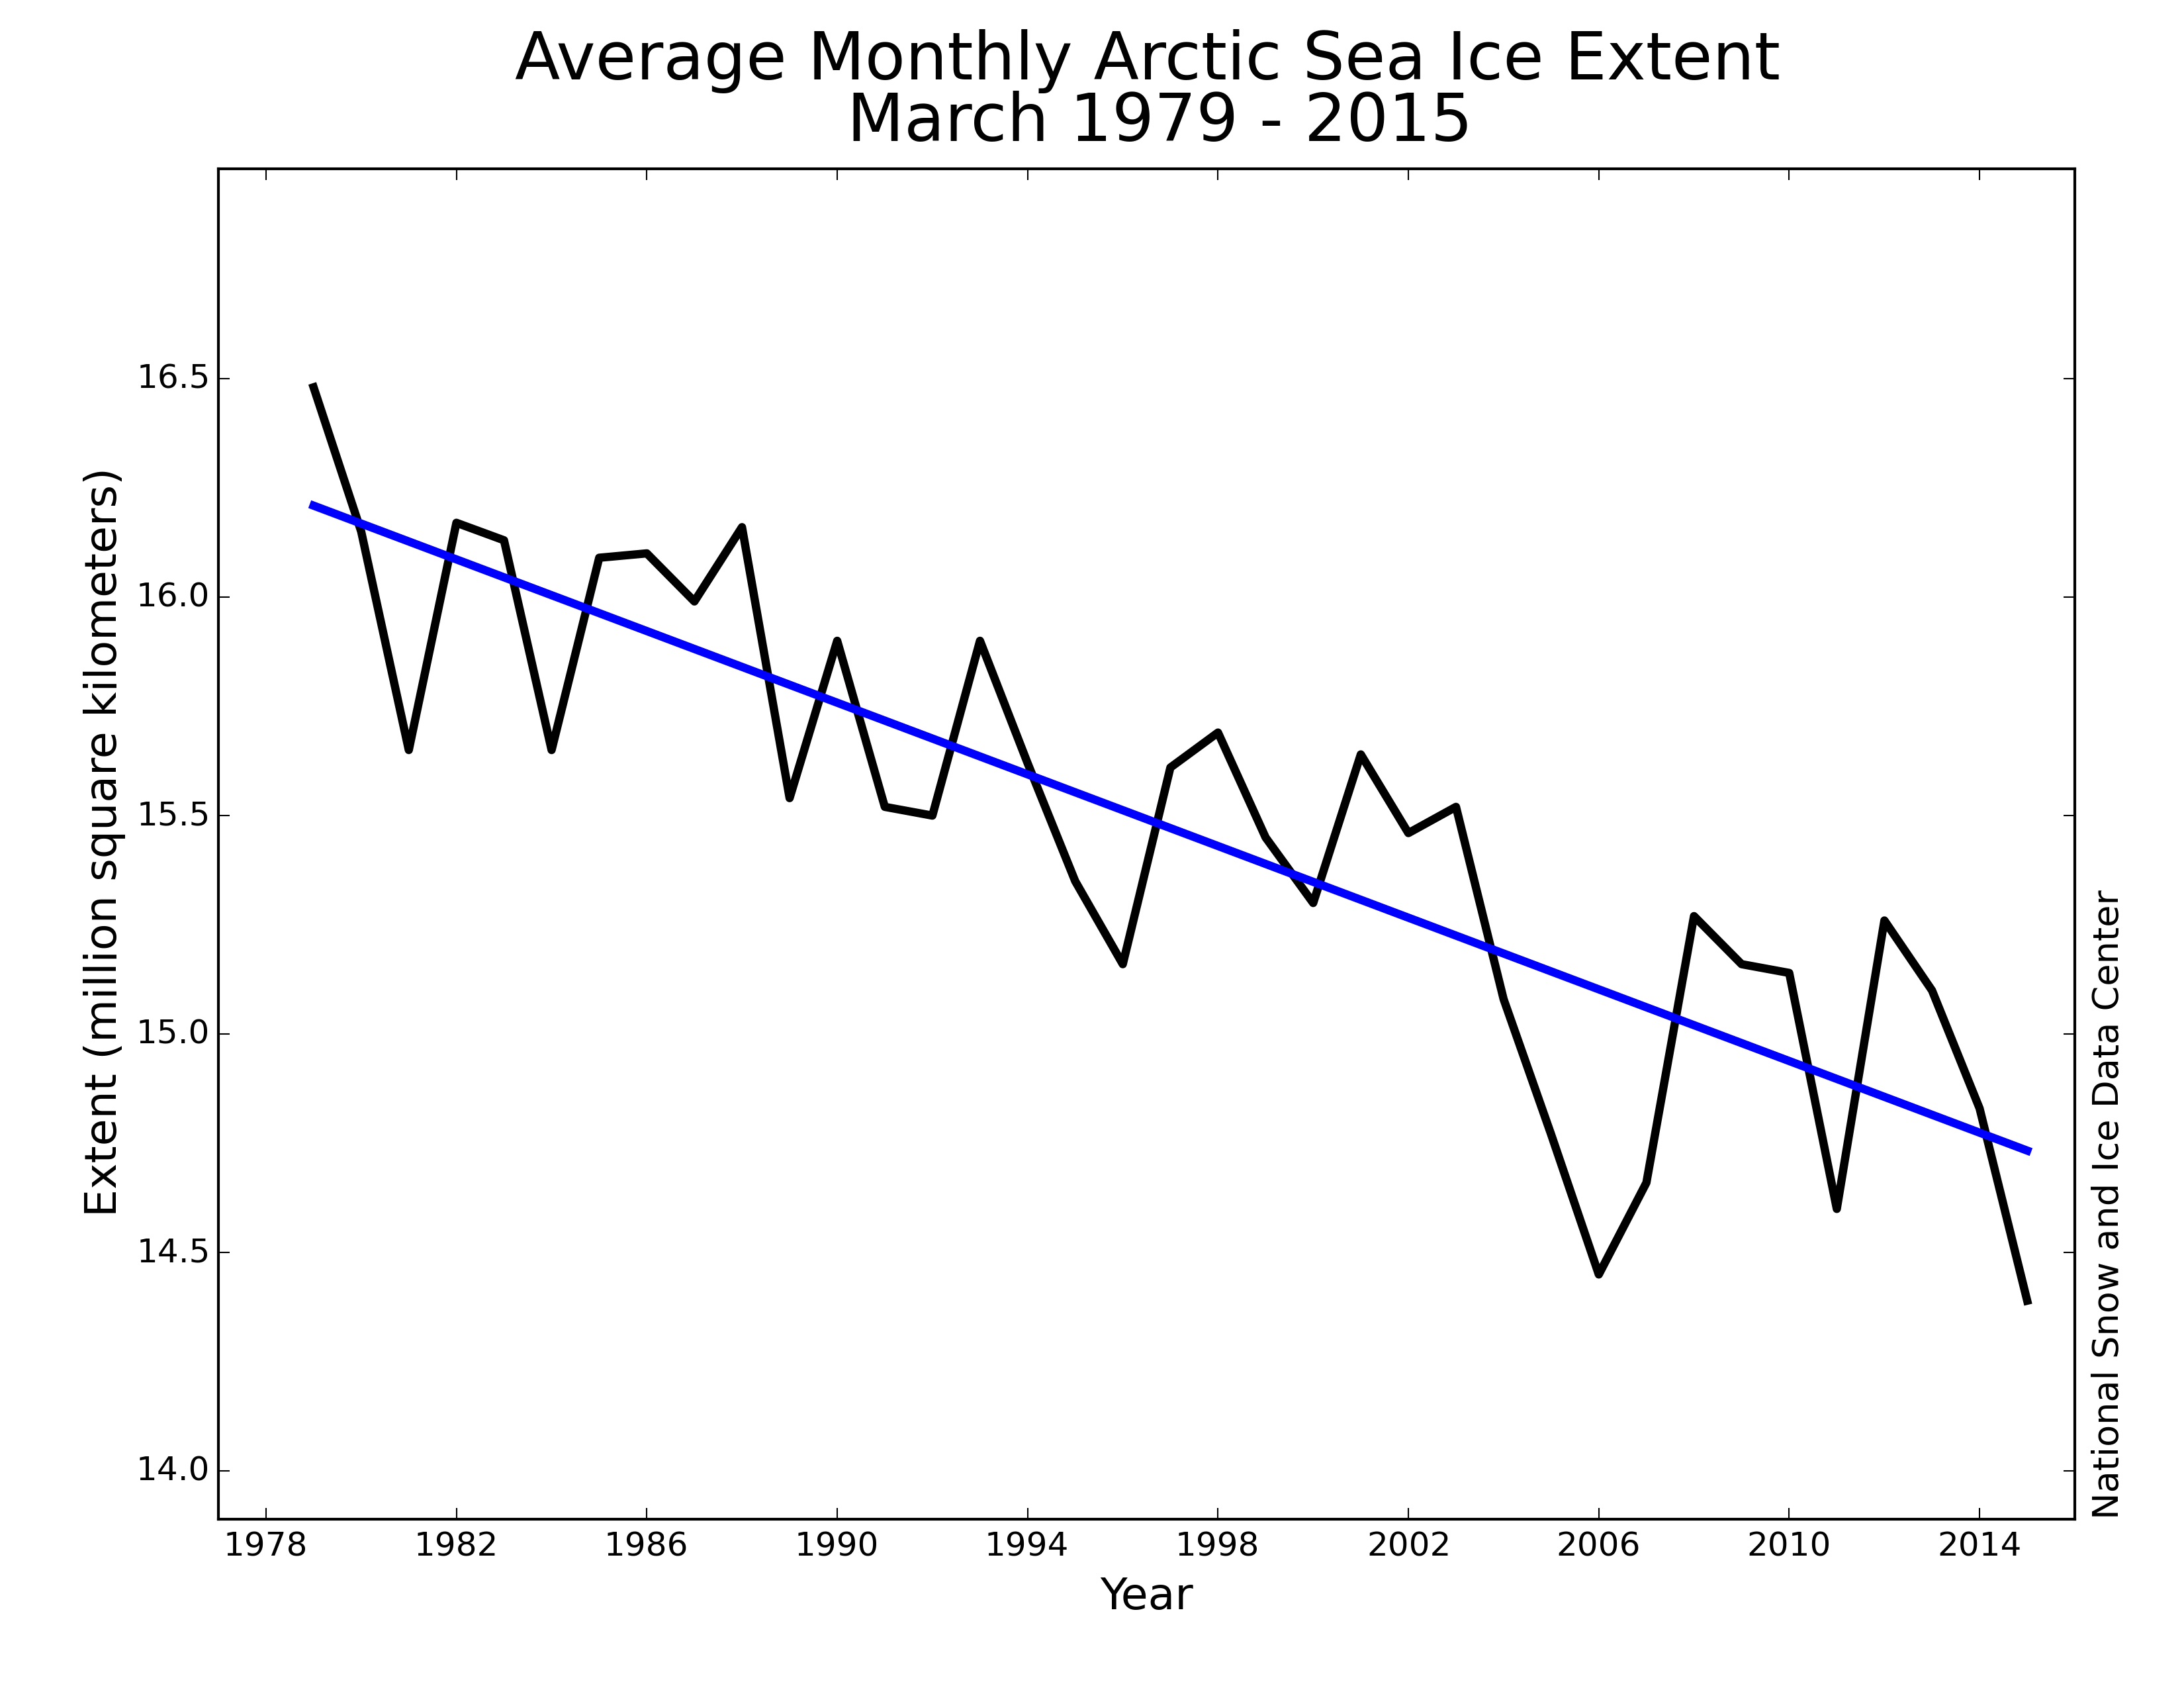
Figure 3. Monthly March ice extent for 1979 to 2015 shows a decline of 2.6% per decade relative to the 1981 to 2010 average.
Credit: National Snow and Ice Data Center
High-resolution image
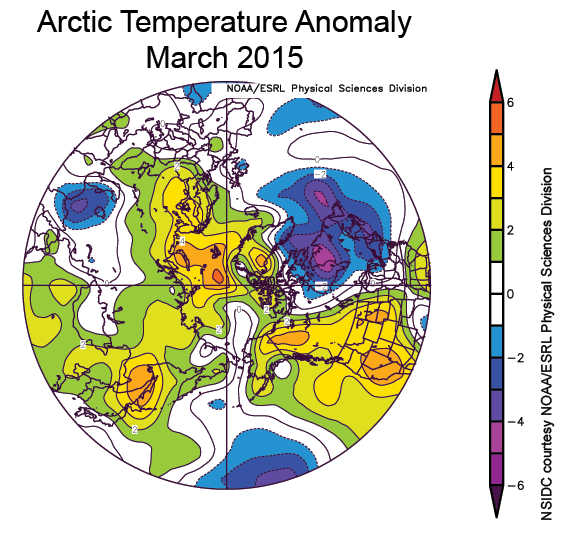
Figure 4. The plot shows Arctic air temperature anomalies at the 925 hPa level in degrees Celsius for March 2015. Yellows and reds indicate higher than average temperatures; blues and purples indicate lower than average temperatures.
Credit: NSIDC courtesy NOAA Earth System Research Laboratory Physical Sciences Division
High-resolution image
This is what is the proof of the experiment that we are at present conducting on this planet.
graphs are funny things. they can say a lot but they can also imply things that arent really there.

has arctic sea ice extent dropped from the high point in 1979? yes, both the average max and min have declined.. does this graph look like a death spiral? no. it would look even less like one with the extra four years of data added.
When will the summer Arctic be nearly sea ice free - Overland - 2013 - Geophysical Research Letters - Wiley Online Library
When will the summer Arctic be nearly sea ice free?
James E. Overland1 and Muyin Wang2
Received 27 December 2012; revised 21 February 2013; accepted 1 March 2013; published 21 May 2013.
[1] The observed rapid loss of thick multiyear sea ice over the last 7 years and the September 2012 Arctic sea ice extent reduction of 49% relative to the 1979–2000 climatology are inconsistent with projections of a nearly sea ice-free summer Arctic from model estimates of 2070 and beyond made just a few years ago. Three recent approaches to predictions in the scientific literature are as follows: (1) extrapolation of sea ice volume data, (2) assuming several
more rapid loss events such as 2007 and 2012, and (3) climate model projections. Time horizons for a nearly sea ice-free summer for these three approaches are roughly 2020 or earlier, 203010 years, and 2040 or later. Loss estimates from models are based on a subset of the most rapid ensemble members. It is not possible to clearly choose one approach over another as this depends on the relative weights given to data versus models. Observations and
citations support the conclusion that most global climate model results in the CMIP5 archive are too conservative in their sea ice projections. Recent data and expert opinion should be considered in addition to model results to advance the very likely timing for future sea ice loss to the first half of the 21st century, with a possibility of major loss within a decade or two. Citation: Overland, J. E., and M. Wang (2013), When will the summer Arctic be nearly sea ice
free?, Geophys. Res. Lett., 40, 2097–2101, doi:10.1002/grl.50316.
graph from IPCC FAR
FAR = FIRST Assesment Report, released in 1990, TWENTY FIVE YEARS AGO.
AR5 = FIFTH Assessment Report, released in 2013

and
Old Rocks
Diamond Member
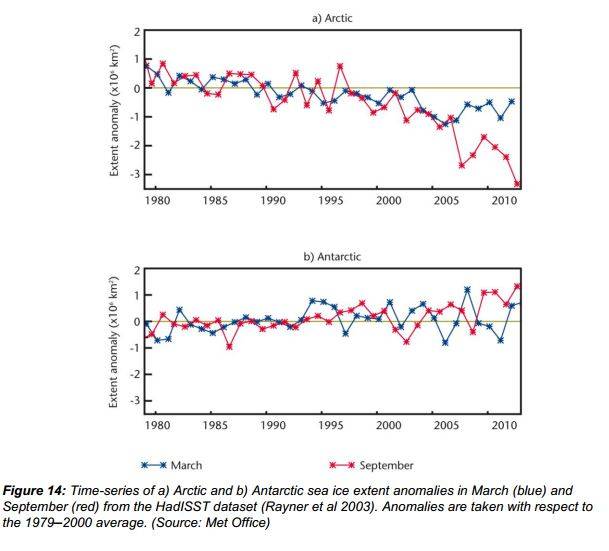
Your anamoly on that graph is about -1.5 for 1992. On this graph it is less than -1.Do you deny Arctic ice extents are dropping? Do you deny Arctic ice mass is dropping? And it is doing so most dramatically during the period you folks keep telling us proves that global warming has ended and that (your buddies say) CO2 has no effect on temperature.
hahahaha, crick is at it again. he implies that I deny arctic ice extent is dropping but he neglects to quote what I said.
has arctic sea ice extent dropped from the high point in 1979? yes, both the average max and min have declined.. does this graph look like a death spiral? no. it would look even less like one with the extra four years of data added.
he finds it easier to argue with strawmen that only exist in his fevered imagination.
and if we had full satellite coverage from 1974 instead of 1979 then it would show an upturn before the downturn
graph from IPCC FAR
http://arctic.atmos.uiuc.edu/cryosphere/IMAGES/seaice.anomaly.arctic.png
I would have to state that what you have presented in your graph is a severe case of cherry picking. For you did not include the last twenty years, which the graph that I have posted does. And since 2003, even that the graph in the link has a lower zero line, no year has gone into the plus category, and two have dipped below -2.5.
If you wish credibility, present data that is up to date, when the question concerns decline or increase over time.
dont be shy, show your graph

another graph that is certainly not a death spiral
- May 20, 2009
- 144,230
- 66,525
- 2,330
Ice melt is caused by soot from China and India
Ice melt is caused by soot from China and India
Then your freezer, being thoroughly protected from Chinese and Indian soot, may be unplugged without anything getting warm and melting. Right?
- May 20, 2009
- 144,230
- 66,525
- 2,330
Ice melt is caused by soot from China and India
Then your freezer, being thoroughly protected from Chinese and Indian soot, may be unplugged without anything getting warm and melting. Right?
My models show the freezer remains at 20 F
You brought up the real world. I carried on in your wake. This was one of those real world experiments you've always wanted to see.
The point - the obvious one that you failed to see - is that soot does cause some melting. So do increased temperatures. And, for that matter, where does most soot come from? Most of it comes from people burning coal.
The point - the obvious one that you failed to see - is that soot does cause some melting. So do increased temperatures. And, for that matter, where does most soot come from? Most of it comes from people burning coal.
- May 20, 2009
- 144,230
- 66,525
- 2,330
Im still trying to figure out how the CO2 Glacier Eating Spaghetti Monster managed to unplug my refrigerator
- Dec 18, 2013
- 136,297
- 27,872
- 2,180
- Thread starter
- #115
Your model matchs miy model. How interesting!Ice melt is caused by soot from China and India
Then your freezer, being thoroughly protected from Chinese and Indian soot, may be unplugged without anything getting warm and melting. Right?
My models show the freezer remains at 20 F
- Dec 18, 2013
- 136,297
- 27,872
- 2,180
- Thread starter
- #116
You are really hold onto stupid don't you?You brought up the real world. I carried on in your wake. This was one of those real world experiments you've always wanted to see.
The point - the obvious one that you failed to see - is that soot does cause some melting. So do increased temperatures. And, for that matter, where does most soot come from? Most of it comes from people burning coal.
- Dec 18, 2013
- 136,297
- 27,872
- 2,180
- Thread starter
- #117
Now co2 is a he. Holy crapHe did it by outwitting you.
- Dec 18, 2013
- 136,297
- 27,872
- 2,180
- Thread starter
- #119
Oh,ok, so it is a spaghetti monster! Hmmmmmm. Btw, sure it isn't a she?Frank described 'him' as " the CO2 Glacier Eating Spaghetti Monster".
Similar threads
- Replies
- 10
- Views
- 212
- Replies
- 42
- Views
- 442
- Replies
- 80
- Views
- 2K
Latest Discussions
- Replies
- 354
- Views
- 3K
- Replies
- 31
- Views
- 350
- Replies
- 12
- Views
- 108
Forum List
-
-
-
-
-
Political Satire 8032
-
-
-
-
-
-
-
-
-
-
-
-
-
-
-
-
-
-
-
ObamaCare 781
-
-
-
-
-
-
-
-
-
-
-
Member Usernotes 468
-
-
-
-
-
-
-
-
-
-