- Thread starter
- #41
You didn't do the homework -- didya stoner?
OK -- hope you can play guitar or make french fries...
OK -- hope you can play guitar or make french fries...
Follow along with the video below to see how to install our site as a web app on your home screen.

Note: This feature currently requires accessing the site using the built-in Safari browser.
You didn't do the homework -- didya stoner?
OK -- hope you can play guitar or make french fries...
You didn't do the homework -- didya stoner?
OK -- hope you can play guitar or make french fries...
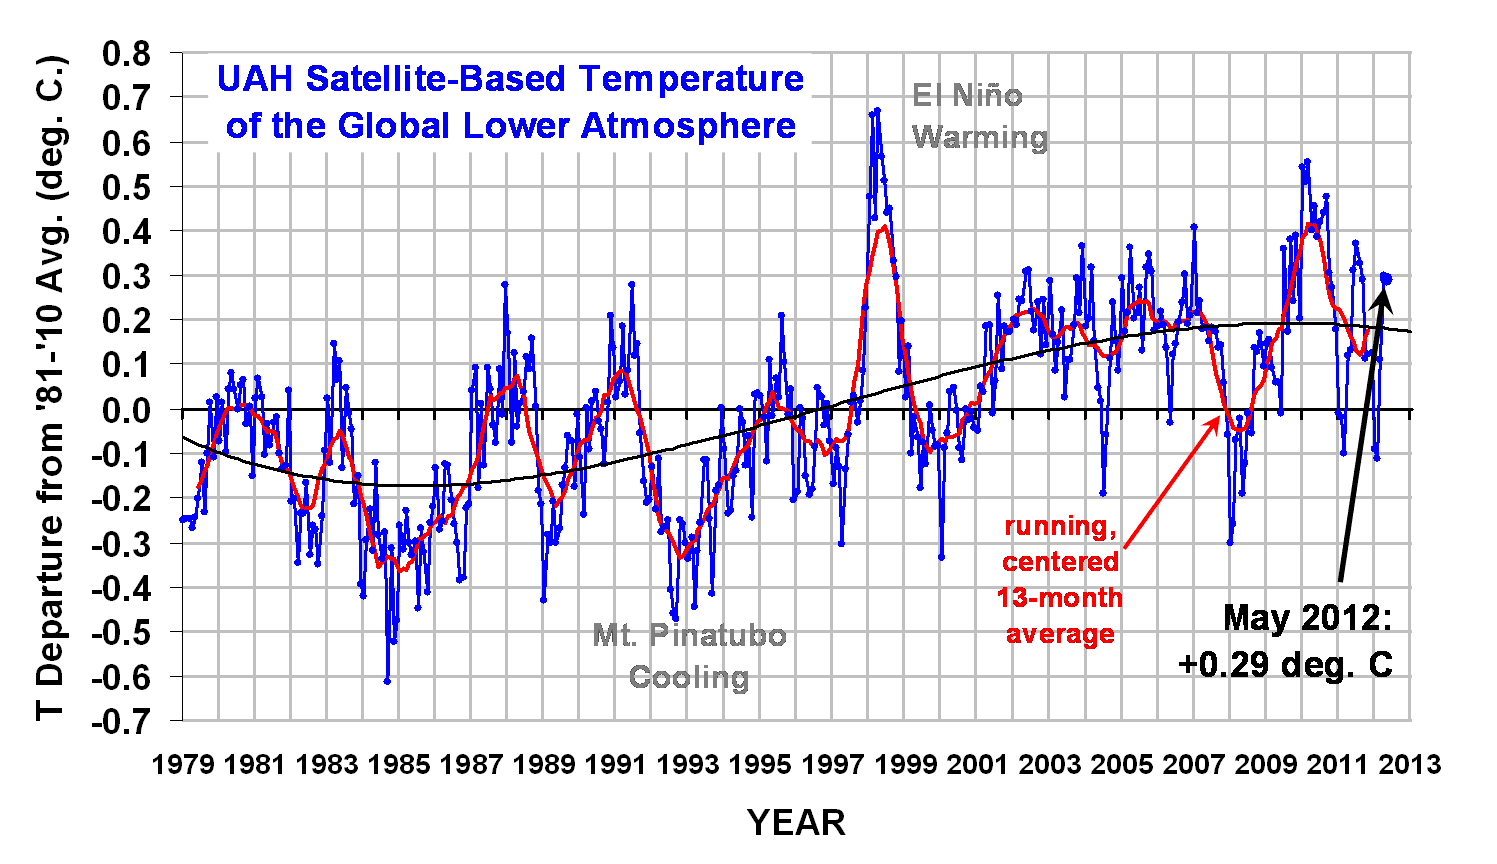
What was the "homework," you homosexual ranter? I posted the graph, for you, punk.
I happen to be able to play guitar, left or right-handed, and I eat baked potatoes.
You didn't do the homework -- didya stoner?
OK -- hope you can play guitar or make french fries...
What was the "homework," you homosexual ranter? I posted the graph, for you, punk.
I happen to be able to play guitar, left or right-handed, and I eat baked potatoes.

That doesn't prove temperatures haven't been flat, you stupid dipstick.
What that linked information proves is temperatures are going up, at an accelerating rate, buttpunk.
So what do you want to actually discuss, or do you just want to fire away?
Wrong, moron. Temperatures have been flat or declining since 1998. Anyone who can read a graph understands that.

