Ocean Acidification pHraud

IanC

Gold Member
Sep 22, 2009
11,061
1,344
245
a report was presented to a Congressional hearing by Dr R Feely, and is now hosted at NOAA. http://www.pmel.noaa.gov/pubs/PDF/feel2899/feel2899.pdf

it contains this graph

vs4qprhmtnXL8FawqRd3cxuPypJqujH_LVmaUAGcdW3x4dZmOPR-zeLwrLApZUvPNihLy5FNRdcpoPZRqsgBPWPDLEwIo232vIxq1PHv6cEYs7DUz1VUT7Kz


chart.png


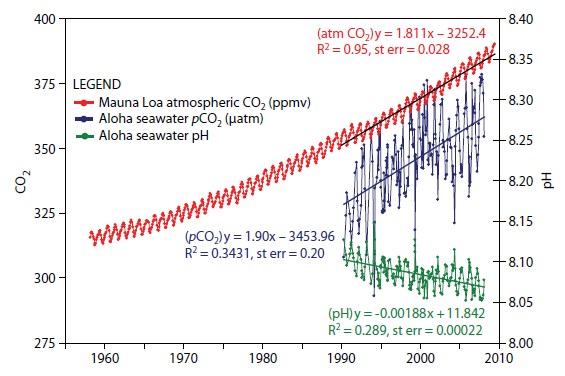
this is the data used to model CO2 and pH changes.

late last year M Wallace contacted A Watts to make public this story. Touchy Feely Science one chart suggests there s a pHraud in omitting Ocean Acidification data in Congressional testimony Watts Up With That

"
Mike Wallace is a hydrologist with nearly 30 years’ experience, who is now working on his Ph.D. in nanogeosciences at the University of New Mexico. In the course of his studies, he uncovered a startling data omission that he told me: “eclipses even the so-called climategate event.” Feely’s work is based on computer models that don’t line up with real-world data—which Feely acknowledged in email communications with Wallace (which I have read). And, as Wallace determined, there is real world data. Feely, and his coauthor Dr. Christopher L. Sabine, PMEL Director, omitted 80 years of data, which incorporate more than 2 million records of ocean pH levels.
"
"
He went to the source. The NOAA paper with the chart beginning in 1850 lists Dave Bard, with Pew Charitable Trust, as the contact.

Wallace sent Bard an email: “I’m looking in fact for the source references for the red curve in their plot which was labeled ‘Historical & Projected pH & Dissolved Co2.’ This plot is at the top of the second page. It covers the period of my interest.” Bard responded and suggested that Wallace communicate with Feely and Sabine—which he did over a period of several months. Wallace asked again for the “time series data (NOT MODELING) of ocean pH for 20th century.” Sabine responded by saying that it was inappropriate for Wallace to question their “motives or quality of our science,” adding that if he continued in this manner, “you will not last long in your career.” He then included a few links to websites that Wallace, after spending hours reviewing them, called “blind alleys.” Sabine concludes the email with: “I hope you will refrain from contacting me again.”
"
"
Interestingly, in this same general timeframe, NOAA reissued its World Ocean Database. Wallace was then able to extract the instrumental records he sought and turned the GEPH data into a meaningful time series chart, which reveals that the oceans are not acidifying. (For another day, Wallace found that the levels coincide with the Pacific Decadal Oscillation.) As Wallace emphasized: “there is no global acidification trend.”
"
mwacompilationofglobalocean_phjan82014.jpg


end paragraph-
“In whose professional world,” Wallace asks, “is it acceptable to omit the majority of the data and also to not disclose the omission to any other soul or Congressional body?”
 
last month Wallace added another article- Ocean pH Accuracy Arguments Challenged with 80 Years of Instrumental Data Watts Up With That

mwallacefigure1.png


end paragraph-
The ocean pH data omission was an unprecedented and disturbing incident in the history of hydrological sciences. Only NOAA can likely correct this. That’s because NOAA contains the source of the problem (the FEEL2899 pH time series product) as well as its solution (the WOD database). To help resolve that paralyzing disorder, scientists and others may wish to consider signing a petition that I have authored at (11). It may seem overly prescriptive, but in some ways it merely asks that the ocean pH data omissions be corrected by NOAA, and that GOpH measurements follow the OA authorities’ own published guidelines.
 
Apparently Wallace is comparing mean oceanic data taken in various locations at various times with data taken from one location over time and complaining of a lack of congruency between the two. This even though ocean pH varies with location and season.

I guess it's the sort of science we've come to expect.


legitimate point I suppose. I just looked over the NOAA report and it doesnt specify that the graph was just for Hawaii, and the language implies global. is it correct in climate science's eyes to ignore the global data and replace it with one locales data from 1988 and estimate through modelling back to 1850? apparently so.

I was also a little bit shocked to hear that Wallace was 'warned' that his investigation would be bad for his career. judging from the climategate emails, I probably shouldnt have been surprised at all.
 
Changes_in_aragonite_saturation_of_the_world%27s_oceans%2C_1880-2012_%28US_EPA%29.png

CAPTION: The map was created by the National Oceanic and Atmospheric Administration and the Woods Hole Oceanographic Institution using Community Earth System Model data. This map was created by comparing average conditions during the 1880s with average conditions during the most recent 10 years (2003–2012). Aragonite saturation has only been measured at selected locations during the last few decades, but it can be calculated reliably for different times and locations based on the relationships scientists have observed among aragonite saturation, pH, dissolved carbon, water temperature, concentrations of carbon dioxide in the atmosphere, and other factors that can be measured. This map shows changes in the amount of aragonite dissolved in ocean surface waters between the 1880s and the most recent decade (2003–2012). Aragonite saturation is a ratio that compares the amount of aragonite that is actually present with the total amount of aragonite that the water could hold if it were completely saturated. The more negative the change in aragonite saturation, the larger the decrease in aragonite available in the water, and the harder it is for marine creatures to produce their skeletons and shells. The global map shows changes over time in the amount of aragonite dissolved in ocean water, which is called aragonite saturation.

In how many locations in the world ocean do you see zero change?
 
Last edited:
I was also a little bit shocked to hear that Wallace was 'warned' that his investigation would be bad for his career. judging from the climategate emails, I probably shouldnt have been surprised at all.

I wasn't. You're listening solely to his side of the story. If Sabine told him he shouldn't be making comments about his motives, then it would seem very likely that Wallace was doing just that. Why would Wallace make a comment about Sabine's motives? Is there any possibility he could have a basis for such a comment? Aside for their conversations about Feely's study (The Oceanic Sink for Anthropogenic CO2 Christopher L. Sabine, Richard A. Feely, Nicolas Gruber, Robert M. Key, Kitack Lee, John L. Bullister, Rik Wanninkhof, C. S. Wong, Douglas, W. R. Wallace, Bronte Tilbrook, Frank J. Millero, Tsung-Hung Peng, Alexander Kozyr, Tsueno Ono, Aida F. Rios) they seem to have been complete strangers. My conclusion - based in part on the fact that Wallace chose to describe this conversation, is that Wallace was acting like a childish ass and earned the comments he got. I took Sabine's comments (if he actually made them) to mean "your career will not advance well if you continue to act like such an ass" rather than any threat of revenge, like "My pals and I will end your career if you don't back off" which is, of course, the standard denier interpretation.
 
Last edited:
I was also a little bit shocked to hear that Wallace was 'warned' that his investigation would be bad for his career. judging from the climategate emails, I probably shouldnt have been surprised at all.

I wasn't. You're listening solely to his side of the story. If Sabine told him he shouldn't be making comments about his motives, then it would seem very likely that Wallace was doing just that. Why would Wallace make a comment about Sabine's motives? Is there any possibility he could have a basis for such a comment? Aside for their conversations about Feely's study (The Oceanic Sink for Anthropogenic CO2 Christopher L. Sabine, Richard A. Feely, Nicolas Gruber, Robert M. Key, Kitack Lee, John L. Bullister, Rik Wanninkhof, C. S. Wong, Douglas, W. R. Wallace, Bronte Tilbrook, Frank J. Millero, Tsung-Hung Peng, Alexander Kozyr, Tsueno Ono, Aida F. Rios) they seem to have been complete strangers. My conclusion - based on the fact that Wallace chose to describe this conversation, is that Wallace was acting like a childish ass and earned the comments he got. I took Sabine's comments (if he actually made them) to mean "your career will not advance well if you continue to act like such an ass" rather than any threat of revenge, "My pals and I will end your career if you don't back off" which is, of course, the standard denier interpretation.


you have a right to interpret it anyway you want.

Feely’s work is based on computer models that don’t line up with real-world data—which Feely acknowledged in email communications with Wallace (which I have read)

I am not sure if the 'which I have read' applies to Noon, the original journalist or Watts. but asking for the data sure got a surly response.
 
That paper was the work of 15 PhDs. Wallace is a student. I will not default to taking Wallace's story and I've seen nothing from the authors yet. Can I count on you to dig up their response to Wallace's comments?
 
That paper was the work of 15 PhDs. Wallace is a student. I will not default to taking Wallace's story and I've seen nothing from the authors yet. Can I count on you to dig up their response to Wallace's comments?


here we go again. kinda like when you called Nic Lewis 'unemployed'.

Mike Wallace is a hydrologist with nearly 30 years’ experience, who is now working on his Ph.D. in nanogeosciences at the University of New Mexico. In the course of his studies, he uncovered a startling data omission that, he told me, “eclipses even the so-called climategate event.” - See more at: What if Obama s climate change policies are based on pHraud

or you could just go to his website. it appears that he has made an appearance at the AGU. About MW A - Michael Wallace Associates
 
What do the Iranian nuke talks have to do with ocean acidification?
 
For all you know, the man specialized in crop irrigation.

That you immediately accept the word of Wallace against the professional opinion of 15 PhDs in a peer reviewed paper tends to indicate that you approached the question with an answer already in mind.
 
For all you know, the man specialized in crop irrigation.

That you immediately accept the word of Wallace against the professional opinion of 15 PhDs in a peer reviewed paper tends to indicate that you approached the question with an answer already in mind.


You can see his last ten years of projects on his website. He found the discrepancy in the data while researching for his doctorate. That's why he was pissed that the data was being hidden.

Edit- most papers only have a few main authors, the others usually only provide specific details.
 
Changes_in_aragonite_saturation_of_the_world%27s_oceans%2C_1880-2012_%28US_EPA%29.png

CAPTION: The map was created by the National Oceanic and Atmospheric Administration and the Woods Hole Oceanographic Institution using Community Earth System Model data. This map was created by comparing average conditions during the 1880s with average conditions during the most recent 10 years (2003–2012). Aragonite saturation has only been measured at selected locations during the last few decades, but it can be calculated reliably for different times and locations based on the relationships scientists have observed among aragonite saturation, pH, dissolved carbon, water temperature, concentrations of carbon dioxide in the atmosphere, and other factors that can be measured. This map shows changes in the amount of aragonite dissolved in ocean surface waters between the 1880s and the most recent decade (2003–2012). Aragonite saturation is a ratio that compares the amount of aragonite that is actually present with the total amount of aragonite that the water could hold if it were completely saturated. The more negative the change in aragonite saturation, the larger the decrease in aragonite available in the water, and the harder it is for marine creatures to produce their skeletons and shells. The global map shows changes over time in the amount of aragonite dissolved in ocean water, which is called aragonite saturation.

In how many locations in the world ocean do you see zero change?

Can you provide the measurements from 1880?


Not from the stated method in the paper.
 

Forum List

Back
Top