Nobel Prize-Winning Physicist Resigns Over Global Warming

The hockey stick has been supported by over half a dozen papers since 1998.

Half a dozen? Wow. Here is a recently published study that looks at 60 published studies since 1998 covering points around the globe that don't agree with it and comes to the conclusion that both the Roman and Medieval warming periods were both global, and considerably warmer than the present.

http://climategate.nl/wp-content/uploads/2011/09/Lunqvistgeografie.pdf

Face it Matthew, it's a hoax. CAGW has always been a politically motivated hoax and it will always be a politically motivated hoax.


Thermal Maximum
with temperatures more than 2°C warmer than during the pre-industrial
period (Huang, Pollack, Shen 2008). If the mid-Holocene Thermal Maximum
indeed represented a considerable global warming, it presupposes strong
All in all, the glaciological evidence seems to broadly support the
spatio-temporal pattern of periods with temperatures at least 1°C and 2°C,
respectively, above the pre-industrial level.


These temperatures are compared to the per-industrial, so lets say 1750-1780...If so about .09c colder then today give or take +-.02c. So YES this says that the HCO was warmer then today. Some agree it was and some don't...Most official data will agree with 1 to 1.2c warmer then today during the HCO too...Hansen is one of the few that won't an that is his opinion...Lastly we both know that the tilt of the earth's axis greatly favored increased direct energy from the sun on the poles. So they were getting a heck of a lot more energy then today. Orbit that favored more energy into the climate system favored the HCO to be WARMER...Yes, it was caused by the sun.


"The onset of the Neoglaciation seems to occur c. 4–3 ka BP. In
some records, mainly but not exclusively from the high northern latitudes, a
new multi-centennial period of temperatures exceeding those of the pre-industrial
(~1750 AD) period by more than 1°C seems to have occurred during the
Medieval Warm Period"

Being that it was -.9c colder in 1750s then today whats 1c warmer then during the med evil mean for today? This just pointed out that we're equal to it!
 
Last edited:
The Hockey Stick is a proven fraud. The National Academy of sciences admitted it is a fraud. Anyone using the Hockey Stick to support AGW is a con artist or an idiot.
I hate the political side of it and don't support any regulations at all, but the ice sheets have trended downwards on the means through the past 5 years. Do you understand what a anomaly is? 2007 was one. The volume is down millions of km^2 since 2007 and you think they're recovering...Man the nuclear bomb, man the fucking bomb!!! :eusa_whistle:

The hockey stick has been supported by over half a dozen papers since 1998. Tree rings, boer holes, ocean sediment. ect. The closes thing your side has is something that was made in the early 1990's that is based off of the northern Hemisphere. Well, I will say that it's possible that a large part of the world was warmer then today within the mid evil at times, but basing something out of a few places that made it possible for wine or farming on earth to go against all these data points may not be the best way to go about it...Wouldn't you agree?:eusa_pray: Consensus don't mean shit within science; one scientist can kick it straight in its balls either way!

NH_Temp_Reconstruction.gif


MobergMannLjungkvist.gif


How does Ljungqvist's reconstruction compare to others?

"Our temperature reconstruction agrees well with the reconstructions by Moberg et al. (2005) and Mann et al. (2008) with regard to the amplitude of the variability as well as the timing of warm and cold periods, except for the period c. AD 300–800, despite significant differences in both data coverage and methodology.”

"Since AD 1990, though, average temperatures in the extra-tropical Northern Hemisphere exceed those of any other warm decades the last two millennia, even the peak of the Medieval Warm Period”

The green line ended in 1980, which is .4c below today.
This takes the decade of the 2000's about .1c to .2c above the midevil.

THIS IS NOT A GODDAMN POLITICAL ISSUE, but one of science!

Well, that chart did have half a dozen of the studies of the past decade backing it...So if you're going to say that the proxies are trash...Then what is your method of knowing the climate of the overall earth of the past 10,000 years or even 500 years? Sure, you can point out wine tax list throughout europe and show that there was farms in greenland throughout the midevil....You can even show us paintings of ice on rivers that never froze over today and historic written record throughout europe, but THAT IS NOT THE WORLD. It would be like saying that a dozen winters that were -AO induced within the Briton brought a decade of record cold weather and some how saying that was the norm for the WHOLE WORLD.

So you can't point out historical record or paintings to tell the global scale...Temperature measuring devises weren't even developed intill the 17th-18th century. :lol::lol::lol:

If you have a study that uses proxies that you can get behind then PLEASE post it, but remember it must be peer reviewed as these blogs screw with the data.:lol::lol::lol:

Matthew- you seem to post a lot of links to SkepticalScience. I dont have a problem with that as long as you realize that they are just as distorted as most skeptical blogs. do you read Climate Audit? I ask this because I find it very interesting to see comments and criticisms from both sides because it points out the blind spots that either side likes to hide.

you also seem to believe that the post MBH98,99 studies are free of the same faults as the originals. they use many of the same proxy sets and often have just as sketchy methodologies as Mann.

back in 2007 a mathematician specializing in ecology decided to make a reconstruction from non treering proxies in the existing proxy repositories that were already calibrated to anomalies. basically he just took them off the shelf and averaged them, no methodologies to enhance the temperature signals. no trimming, no infilling, no excluding, just averaging. he just wanted to see what it would look like.

loehle_fig2.JPG


amazingly like Lamb's IPCC reconstruction pre-Hockey Stick.
HHLamb_temperatures_1000-1990AD_620pixs.jpg


the interesting part is that the shape of the graph wasnt dependant on just a few of the proxies unlike the Hockey Stick and its corrupt progeny.

of course the Team attacked it but it was interesting that Loehle just answered the critics comments, added a statistician, and reworked the paper in less than a year. and of course his code and data were publically available. does that sound like how the Hockey Team works? no, it sure doesnt.
 
The Hockey Stick is a proven fraud. The National Academy of sciences admitted it is a fraud. Anyone using the Hockey Stick to support AGW is a con artist or an idiot.

Well, that chart did have half a dozen of the studies of the past decade backing it...So if you're going to say that the proxies are trash...Then what is your method of knowing the climate of the overall earth of the past 10,000 years or even 500 years? Sure, you can point out wine tax list throughout europe and show that there was farms in greenland throughout the midevil....You can even show us paintings of ice on rivers that never froze over today and historic written record throughout europe, but THAT IS NOT THE WORLD. It would be like saying that a dozen winters that were -AO induced within the Briton brought a decade of record cold weather and some how saying that was the norm for the WHOLE WORLD.

So you can't point out historical record or paintings to tell the global scale...Temperature measuring devises weren't even developed intill the 17th-18th century. :lol::lol::lol:

If you have a study that uses proxies that you can get behind then PLEASE post it, but remember it must be peer reviewed as these blogs screw with the data.:lol::lol::lol:

Matthew- you seem to post a lot of links to SkepticalScience. I dont have a problem with that as long as you realize that they are just as distorted as most skeptical blogs. do you read Climate Audit? I ask this because I find it very interesting to see comments and criticisms from both sides because it points out the blind spots that either side likes to hide.

you also seem to believe that the post MBH98,99 studies are free of the same faults as the originals. they use many of the same proxy sets and often have just as sketchy methodologies as Mann.

back in 2007 a mathematician specializing in ecology decided to make a reconstruction from non treering proxies in the existing proxy repositories that were already calibrated to anomalies. basically he just took them off the shelf and averaged them, no methodologies to enhance the temperature signals. no trimming, no infilling, no excluding, just averaging. he just wanted to see what it would look like.

loehle_fig2.JPG


amazingly like Lamb's IPCC reconstruction pre-Hockey Stick.
HHLamb_temperatures_1000-1990AD_620pixs.jpg


the interesting part is that the shape of the graph wasnt dependant on just a few of the proxies unlike the Hockey Stick and its corrupt progeny.

of course the Team attacked it but it was interesting that Loehle just answered the critics comments, added a statistician, and reworked the paper in less than a year. and of course his code and data were publically available. does that sound like how the Hockey Team works? no, it sure doesnt.


I want and looked at climate audit and WUWT, but really enjoy the indepth science at skeptical science. They're very good at what they do.

A question about loehle reconstruction

-when is the end date? If it's before 1980 then you need to add another .4c to it to find the 2011 temperature. One of the tricks of the skeptic side are to end there graphs in the 19th century or earlier in the 20th century to make the med evil look huge. I of course believe the med evil and little ice age were big charges, but with what I've read don't believe they were bigger then the current change.


I'm not saying that his med evil reconstruction or little ice age reconstruction is wrong...Heck, In fact this is what I believe. I believe that the cycles had changes of .8-1.4c +- for the past 3,000 years.
 
Last edited:
The hockey stick has been supported by over half a dozen papers since 1998. Tree rings, boer holes, ocean sediment. ect. The closes thing your side has is something that was made in the early 1990's that is based off of the northern Hemisphere. Well, I will say that it's possible that a large part of the world was warmer then today within the mid evil at times, but basing something out of a few places that made it possible for wine or farming on earth to go against all these data points may not be the best way to go about it...Wouldn't you agree?:eusa_pray: Consensus don't mean shit within science; one scientist can kick it straight in its balls either way!


How does Ljungqvist's reconstruction compare to others?

"Our temperature reconstruction agrees well with the reconstructions by Moberg et al. (2005) and Mann et al. (2008) with regard to the amplitude of the variability as well as the timing of warm and cold periods, except for the period c. AD 300–800, despite significant differences in both data coverage and methodology.”

"Since AD 1990, though, average temperatures in the extra-tropical Northern Hemisphere exceed those of any other warm decades the last two millennia, even the peak of the Medieval Warm Period”

The green line ended in 1980, which is .4c below today.
This takes the decade of the 2000's about .1c to .2c above the midevil.

THIS IS NOT A GODDAMN POLITICAL ISSUE, but one of science!

I believe the hockey stick graph was debunked by east anglia climate gate scandal.
It was founded to have cherry picked data from co-author Keith Briffa. When you cherry pick data, it no longer becomes science but a scam.
 
Oh My God! Matthew did you just say one of the tricks of the skeptical side is to cut off the reconstruction period? hahahahaha. what do you think 'hide the decline' was about? hahahaha, you definitely need to get out more. dude you have been indoctrinated. wow!
 
Oh My God! Matthew did you just say one of the tricks of the skeptical side is to cut off the reconstruction period? hahahahaha. what do you think 'hide the decline' was about? hahahaha, you definitely need to get out more. dude you have been indoctrinated. wow!

What decline? You mean 2007-2008 nina? I will tell you one thing the warming has slowed the past decade, but we have to ask why. The why's could be explained by aerosals and decreasing tsi. Why not?

Or is it this?

What do the 'Climategate' hacked CRU emails tell us?

"I've just completed Mike's Nature trick of adding in the real temps to each series for the last 20 years (ie from 1981 onwards) and from 1961 for Keith's to hide the decline."

"Mike's Nature trick" refers to a technique (aka "trick of the trade") used in a paper published in Nature by lead author Michael Mann (Mann 1998). The "trick" is the technique of plotting recent instrumental data along with the reconstructed data. This places recent global warming trends in the context of temperature changes over longer time scales.

The most common misconception regarding this email is the assumption that "decline" refers to declining temperatures. It actually refers to a decline in the reliability of tree rings to reflect temperatures after 1960. This is known as the "divergence problem" where tree ring proxies diverge from modern instrumental temperature records after 1960. The divergence problem is discussed in the peer reviewed literature as early as 1995, suggesting a change in the sensitivity of tree growth to temperature in recent decades (Briffa 1998). It is also examined more recently in Wilmking 2008 which explores techniques in eliminating the divergence problem. So when you look at Phil Jone's email in the context of the science discussed, it is not the schemings of a climate conspiracy but technical discussions of data handling techniques available in the peer reviewed literature. More on the hockey stick divergence problem...


...
Believe me, I know about the tree ring problem, but that is most likely unnatural in its self. BUT no other proxie shows this and in fact before the 1950s tree rings worked with the others. So you have to explain to me why this isn't unnaturally caused...Honestly, why is skeptical science case wrong?

Lastly, what is the cut off on that graph you posted for me?

:eusa_whistle:
 
Last edited:
halftime....

why are you arguing cutoff dates rather than the shape of the graphs?

if treerings arent working now why do you think they worked all the time in the past? it not like the proxies match each other exactly, or even very closely. its only when you put a bunch together that you get a hint of what happened in the past. cutting off the bits and pieces you dont like is not science its propaganda. any other field would censure a lot of the bogus methods used in climate science.

No, that's not what I'm talking about....What I'm talking about is ending in the 1950s would result in .4c cooler then it's in 2011. This doesn't show the true temperature, right now compared to the med evil, which is very close. Your graph shows .6c for the med evil, but .15c for the peak at mid 20th century. Yes, I understand that some proxies have there weakness, but as I posted above the tree rings the past 60 years have there own unnatural problem. Don't you agree? I'm talking about your graph.

Do I understand that there is a tree ring problem after 1950, yes! But peer review science says it is caused by unnatural factors and it worked until then.


Seriously, I disagree with Mann as I believe that the med evil and little ice age occurred the way that graph says they did, so I agree with your graph. BUT I do disagree with cutting it off at the mid century; which doesn't give the current warming the respect it deserves.
 
Last edited:
Dr. Ivar Giaever is a smart cookie, alright. His field is...mechanical Engineering, his Nobel prize was for research into phenomena related to superconductors. NOT meteorology. So, take this thread with a grain of salt. His views on global warming are well known. He said "It is amazing how stable temperature has been over the last 150 years." Well, if anyone here has any doubts as to this fellow’s observation on weather, Dallas recently recorded it’s hottest summer in recorded history. Any of you that live in the American Midwest, also realize how much hotter and drier it’s become. Ice fields and glaciers that have existed for thousands of years have dramatically shrunk or disappeared in the last TEN years! That isn’t a strong endorsement of “stable climate for over 150 years”. This guy seems intent on rejecting the facts, along with many of the rest of you people on this thread.
 
Last edited:
Looks to me that it peaked in the 1950's and then went down really fast like it did in the 1960s-1970s...I added a red line with a red X. The first one is 2000 and the second one is 2010.

The red dots between 1975-2000 to the first X...So it appears as a very quick rise, in which it was!


-.15c from 1950 to 1970 drop...Followed by .4c raise by 2000 and .15c by 2010.
http://data.giss.nasa.gov/gistemp/graphs/Fig.A2.gif
 

Attachments

  • $loehle_fig2.JPG
    $loehle_fig2.JPG
    22.8 KB · Views: 80
Last edited:
Looks to me that it peaked in the 1950's and then went down really fast like it did in the 1960s-1970s...I added a red line with a red X. The first one is 2000 and the second one is 2010.

The red dots between 1975-2000 to the first X...So it appears as a very quick rise, in which it was!


And very much like what happened 1,100 or so years ago.

It sure does look like it :eek: 
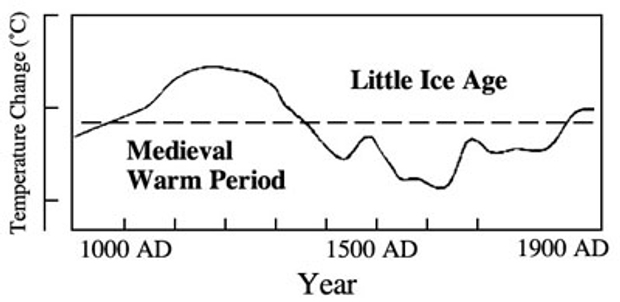
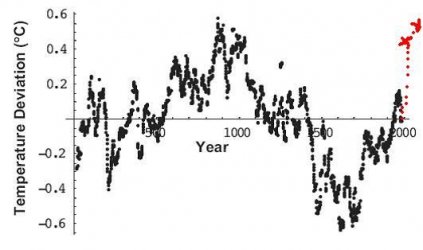
We saw something close to this happen based on the graph in the 9th century.

This supports the conclusion of wirebenders paper on the last page too for the mid evil warm period.:lol::lol::lol::lol:

http://www.usmessageboard.com/4154802-post41.html
 
Last edited:
Why do you attribute all the information on AGW to Al Gore, CG? Have you failed to research the background information on the subject?

From Fourier in the 1820's to today, there has been a vast amount of research in the study of how GHGs affect the climate. Done by scientists from many nations and political systems. Almost all have come to the conclusion that adding GHGs to the atmosphere is leading to a warming earth, and a changing climate. Politisizing that is not only stupid, it will lead to the people that politisized it being looked on as dangerous to society as the chickens come home to roost.


From a completely apolitical viewpoint, how's that Argo Array thingy working out to support the notion of warming oceans?


2_OHC-2005-2010.jpg


Figure 1 -Revised estimate of global ocean heat content (10-1500 mtrs deep) for 2005-2010 derived from Argo measurements. The 6-yr trend accounts for 0.55±0.10Wm−2. Error bars and trend uncertainties exclude errors induced by remaining systematic errors in the global observing system. See Von Schuckmann & Le Traon (2011)

Argo I believe can't really be used before 2003-2004 time span.


I seem to recall that the general consensus of the AGW community was that the ARGO Array would reveal the warming of the ocean to be extreme. The chart says that the data for the time after which ARGO was on line takes up EXACTLY where the previous record left off.

Interesting.

The general consensus of the AGW following the data gathering by ARGO was that the calibration or something must be off because the readings were not revealing the results they expected.

Why was the reaction of the AGW community one of surprise while the transition in the graph is seamless? The words "correction" and 'adjustment" figure prominently in the interpretation and subsequent changing of the data to conform to the anticiapated results.

No problem, we’ll adjust the data to fit the model « Statistical Modeling, Causal Inference, and Social Science


<snip>
And as for the cooling of the oceans, well, there was a “correction” for that, too. It started with a close look at the ocean temperature data, which were not only hard to explain, they seemed to contradict other data sources. It’s true that the huge array of floating robots was intended to be the best single source of worldwide ocean temperature data, but it’s not the only source, and other sources didn’t see the cooling. While the satellite data had suggested that cooling could have occurred, it was possible to believe, barely, that it had. But once the satellite data were corrected and showed that the earth was gaining, not losing, heat, the ocean temperature data looked increasingly wrong. Eventually the original NASA investigator, Willis, had to agree that something was wrong: as data continued to pour in, month after month, some parts of the oceans, especially in the Atlantic, were cooling very quickly. So quickly, in fact, that it seemed physically impossible to account for the missing heat. By early 2007, Willis was convinced: his data were wrong, and the ocean cooling he had reported several years earlier may not have occurred at all. You can read the story on a NASA website, it’s pretty interesting. In short, although most of the thermometers on the 3000 undersea robots were reporting accurate data, a small number were reporting temperatures far too low…so low that even the limited numbers of such measurements were enough to substantially underestimate the average temperature. What’s more, some of the older measurements, from before the start of Argo, were found to be too high. When the older measurements were adjusted downward, and the more recent measurements were adjusted upwards, the result was an ocean warming trend that was consistent with the satellite measurements…which, remember, were themselves adjusted in a way that removed a cooling trend that had initially been reported.
<snip>
 
AMS Journals Online - Warming of Global Abyssal and Deep Southern Ocean Waters between the 1990s and 2000s: Contributions to Global Heat and Sea Level Rise Budgets*

Abyssal global and deep Southern Ocean temperature trends are quantified between the 1990s and 2000s to assess the role of recent warming of these regions in global heat and sea level budgets. The authors 1) compute warming rates with uncertainties along 28 full-depth, high-quality hydrographic sections that have been occupied two or more times between 1980 and 2010; 2) divide the global ocean into 32 basins, defined by the topography and climatological ocean bottom temperatures; and then 3) estimate temperature trends in the 24 sampled basins. The three southernmost basins show a strong statistically significant abyssal warming trend, with that warming signal weakening to the north in the central Pacific, western Atlantic, and eastern Indian Oceans. Eastern Atlantic and western Indian Ocean basins show statistically insignificant abyssal cooling trends. Excepting the Arctic Ocean and Nordic seas, the rate of abyssal (below 4000 m) global ocean heat content change in the 1990s and 2000s is equivalent to a heat flux of 0.027 (±0.009) W m&#8722;2 applied over the entire surface of the earth. Deep (1000&#8211;4000 m) warming south of the Subantarctic Front of the Antarctic Circumpolar Current adds 0.068 (±0.062) W m&#8722;2. The abyssal warming produces a 0.053 (±0.017) mm yr&#8722;1 increase in global average sea level and the deep warming south of the Subantarctic Front adds another 0.093 (±0.081) mm yr&#8722;1. Thus, warming in these regions, ventilated primarily by Antarctic Bottom Water, accounts for a statistically significant fraction of the present global energy and sea level budgets.
 
Now there's a new paper in press, "Deep ocean warming assessed from altimeters, Gravity Recovery and Climate Experiment, in situ measurements, and a non-Boussinesq ocean general circulation model", Song, Y. T., and F. Colberg (2011).
Welcome to AGU Online Services

You need an AGU membership to read it, but here's the abstract:

Observational surveys have shown significant oceanic bottom-water warming, but they are too spatially and temporally sporadic to quantify the deep ocean contribution to the present day sea-level rise (SLR). In this study, altimetry sea surface height (SSH), GRACE ocean mass, and in-situ upper-ocean (0-700m) steric height have been assessed for their seasonal variability and trend maps. It is shown that neither the global mean nor the regional trends of altimetry SLR can be explained by the upper-ocean steric height plus the GRACE ocean mass. A non-Boussinesq ocean general circulation model (OGCM), allowing the sea-level to rise as a direct response to the heat added into the ocean, is then used to diagnose the deep-ocean steric height. Constrained by sea-surface temperature data and the top-of-atmosphere (TOA) radiation measurements, the model reproduces the observed upper-ocean heat content well. Combining the modeled deepocean steric height with observational upper-ocean data gives the full-depth steric height. Adding a GRACE-estimated mass trend, the data-model combination explains not only the altimetry global mean SLR but also its regional trends fairly well. The deep ocean warming is mostly prevalent in the Atlantic and Indian Oceans, and along the Antarctic Circumpolar Current, suggesting a strong relation to the oceanic circulation and dynamics. Its comparison with available bottom-water measurements shows reasonably agreement, indicating that deep-ocean warming below 700 m might have contributed 1.1 mm/year to the global mean SLR or one-third of the altimeter-observed rate of 3.11±0.6 mm/year over 1993-2008
 
Other than basic science courses in highschool and college, I have no experience or expertise in climatology, most especially paleoclimatology. I do, however, have an interest and an insatiable curiosity. And I do have some experience dealing with skewed statistics and data and bogus research.

So I now have questions I would like answered before signing off on an AGW theory and/or policy that will take away many of our freedoms, choices, options, and opportunities and could condemn whole populations of people to more generations of crushing poverty.

1. Is there ANY qualified and credentialed scientist whose funding is not wholly or in part dependent on AGW who agrees that anthropogenic global warming is irrefutable?

2. Has there been any consideration for instrumentation that was installed many years ago in remote, sparsely populated areas and is now closed in by buildings, people, concrete, and asphalt?

3. How do we explain that the models used by 'climate scientists' to show climate change over thousands and millions of years cannot produce the climate we have NOW using conditions for which we do have records? How much faith should we place in their long range forecasts?

4. How do we explain that Arctic ice is forming at a record pace this September despite predictions that it would be all gone over the next several decades? That even NASA has now concluded that Arctic ice has been behaving normally on a predictable 70 year or so cycle? That there has been no significant global warming since 1998 despite the fact that CO2 levels continue to rise every year? Is it possible that CO2 isn't the primary engine that drives climate shifts on our planet after all? (We have had satellite imaging for only about 40 years and good coverage for only about 30 years or less.)

5. Why would scientists exclude the 'skeptics' from particpating in policy summaries and deny them a reasonable forum to make their case unless there were motives unrelated to climate involved?

There is more but that's a pretty good start.
 
1. Is there ANY qualified and credentialed scientist whose funding is not wholly or in part dependent on AGW who agrees that anthropogenic global warming is irrefutable?

Just what the hell do you mean by that statement? Virtually every Scientific Society, every National Academy of Science, and every major University in the world has policy statements out that state that they deem AGW the correct explanation for the warming that we are seeing, and that they regard it as a danger to all of us.

Furthermore, you really seem ignorant concerning the way in which scientific reasearch is done. You get a grant to study a phenomona, not to achieve desired results. When you publish the results of the study, it is critiqued for proper methodology and whether it is presenting any new data or insights into the phenomona being studied. Then other scientists check your article, and resultant hypothesis, and see if they think that you correctly interpreted the data. That is where the scientific fistfight begins.

However, there is not a predetermined result that goes with the grant.
 
2. Has there been any consideration for instrumentation that was installed many years ago in remote, sparsely populated areas and is now closed in by buildings, people, concrete, and asphalt?

Experts Heat Up Over Berkeley Lab Scientist's Quest to 'Calm' Climate Change Debate - NYTimes.com

BEST's preliminary results show a warming trend of 0.7 degrees Celsius since 1957. That result, which Muller called "unexpected," is similar to the findings of independent analyses by NASA, the National Oceanic and Atmospheric Administration and the U.K. Hadley Centre.

"The world temperature data has sufficient integrity to be used to determine temperature trends," Muller told the House Science, Space and Technology Committee.

That contradicts arguments made by climate skeptics -- including blogger Anthony Watts of "Watts Up With That?" -- who allege that many of the weather stations are located in areas that would bias their observations. A station might be placed in a rural area that is eventually enveloped by development, creating a situation where the urban heat island effect could influence the observations it collects, for example.

A study published last year by researchers at NOAA's National Climatic Data Center found evidence that some weather station temperature data are of poor quality -- but it concluded the problematic data would add a slight bias toward cooling in climate analyses.

Watts -- who Muller called "a hero" for his weather station work -- isn't convinced. And he's not happy about the preliminary analysis by Muller's BEST team, judging by comments he posted on his blog. They include a letter rebutting Muller's testimony, which Watts submitted yesterday to the House Science panel before its hearing had concluded
 
3. How do we explain that the models used by 'climate scientists' to show climate change over thousands and millions of years cannot produce the climate we have NOW using conditions for which we do have records? How much faith should we place in their long range forecasts?

Have you stopped beating your wife yet?

This statement, with no evidence that this is the case, whatsoever, is not valid without links to show that this is the case. Do you just repeat whatever the skeptics state, without any research at all?
 
4. How do we explain that Arctic ice is forming at a record pace this September despite predictions that it would be all gone over the next several decades? That even NASA has now concluded that Arctic ice has been behaving normally on a predictable 70 year or so cycle? That there has been no significant global warming since 1998 despite the fact that CO2 levels continue to rise every year? Is it possible that CO2 isn't the primary engine that drives climate shifts on our planet after all? (We have had satellite imaging for only about 40 years and good coverage for only about 30 years or less.)

Good God!

Polar Science Center » Arctic Sea Ice Volume Anomaly, version 2

A 75% decline in ice thickness in just a few decades.

In 1906, Amundsen became the first person to successfully navigate the Northwest Passage. It took him three years in an 80 ton herring boat. Today people routinely go through the Northwest Passage and big freighters and tankers use the Northeast Passage.

You really need to research the history of the attempts to find a polar sea route to the Orient.
 

Forum List

Back
Top