NOAA Hottest Year on Record: 1997 62F

no the average temperature for 1997 was 62.4F. not using any baseline for anything. Why do you keep using baseline figures for 1997? It had an average temperature period. it was 62.4F. if the 20th century average temps was 56.9 then the anomaly/ difference is ~6 degree F. that's it. nothing gets converted or changed or anything. the anomaly is ~6. got it.
Even CF hasn't tried that lie!!!

From CF's OP graphic:

The global average temperature of 62.45 degrees Fahrenheit for 1997 was the warmest year on record, surpassing the previous record set in 1995 by 0.15 degrees Fahrenheit. The chart reflects variations from the 30-year average (1961-1990) of the combined land and sea surface temperatures.
and, I'm not stating anything different. you keep changing the 1997 average. you made it three different figures so far. All he and I are trying to show you is that 1997 average temp is 62.4. and that will never change. EVAH

BTW, do you understand that the average temperature for 1995 was 62.30F right?
 
Last edited:
no the average temperature for 1997 was 62.4F. not using any baseline for anything. Why do you keep using baseline figures for 1997? It had an average temperature period. it was 62.4F. if the 20th century average temps was 56.9 then the anomaly/ difference is ~6 degree F. that's it. nothing gets converted or changed or anything. the anomaly is ~6. got it.
Even CF hasn't tried that lie!!!

From CF's OP graphic:

The global average temperature of 62.45 degrees Fahrenheit for 1997 was the warmest year on record, surpassing the previous record set in 1995 by 0.15 degrees Fahrenheit. The chart reflects variations from the 30-year average (1961-1990) of the combined land and sea surface temperatures.
and, I'm not stating anything different. you keep changing the 1997 average. you made it three different figures so far. All he and I are trying to show you is that 1997 average temp is 62.4. and that will never change. EVAH

BTW, do you understand that the average temperature for 1995 was 62.30F right?
Now you are back to playing dumb so you can keep on lying.
 
no the average temperature for 1997 was 62.4F. not using any baseline for anything. Why do you keep using baseline figures for 1997? It had an average temperature period. it was 62.4F. if the 20th century average temps was 56.9 then the anomaly/ difference is ~6 degree F. that's it. nothing gets converted or changed or anything. the anomaly is ~6. got it.
Even CF hasn't tried that lie!!!

From CF's OP graphic:

The global average temperature of 62.45 degrees Fahrenheit for 1997 was the warmest year on record, surpassing the previous record set in 1995 by 0.15 degrees Fahrenheit. The chart reflects variations from the 30-year average (1961-1990) of the combined land and sea surface temperatures.
and, I'm not stating anything different. you keep changing the 1997 average. you made it three different figures so far. All he and I are trying to show you is that 1997 average temp is 62.4. and that will never change. EVAH

BTW, do you understand that the average temperature for 1995 was 62.30F right?
Now you are back to playing dumb so you can keep on lying.
dude, stop flopping around. do you are do you not agree that the average temperature for 1997 was 62.45 F? I'll start there.
 
no the average temperature for 1997 was 62.4F. not using any baseline for anything. Why do you keep using baseline figures for 1997? It had an average temperature period. it was 62.4F. if the 20th century average temps was 56.9 then the anomaly/ difference is ~6 degree F. that's it. nothing gets converted or changed or anything. the anomaly is ~6. got it.
Even CF hasn't tried that lie!!!

From CF's OP graphic:

The global average temperature of 62.45 degrees Fahrenheit for 1997 was the warmest year on record, surpassing the previous record set in 1995 by 0.15 degrees Fahrenheit. The chart reflects variations from the 30-year average (1961-1990) of the combined land and sea surface temperatures.
and, I'm not stating anything different. you keep changing the 1997 average. you made it three different figures so far. All he and I are trying to show you is that 1997 average temp is 62.4. and that will never change. EVAH

BTW, do you understand that the average temperature for 1995 was 62.30F right?
Now you are back to playing dumb so you can keep on lying.
dude, stop flopping around. do you are do you not agree that the average temperature for 1997 was 62.45 F? I'll start there.
It is you flopping around because you got caught lying about the 1997 global temp "not using any baseline for anything."
 
no the average temperature for 1997 was 62.4F. not using any baseline for anything. Why do you keep using baseline figures for 1997? It had an average temperature period. it was 62.4F. if the 20th century average temps was 56.9 then the anomaly/ difference is ~6 degree F. that's it. nothing gets converted or changed or anything. the anomaly is ~6. got it.
Even CF hasn't tried that lie!!!

From CF's OP graphic:

The global average temperature of 62.45 degrees Fahrenheit for 1997 was the warmest year on record, surpassing the previous record set in 1995 by 0.15 degrees Fahrenheit. The chart reflects variations from the 30-year average (1961-1990) of the combined land and sea surface temperatures.
and, I'm not stating anything different. you keep changing the 1997 average. you made it three different figures so far. All he and I are trying to show you is that 1997 average temp is 62.4. and that will never change. EVAH

BTW, do you understand that the average temperature for 1995 was 62.30F right?
Now you are back to playing dumb so you can keep on lying.
dude, stop flopping around. do you are do you not agree that the average temperature for 1997 was 62.45 F? I'll start there.
It is you flopping around because you got caught lying about the 1997 global temp "not using any baseline for anything."
what again does that mean? what is the definition of baseline? there is no baseline required to calculate a 12 month average temperature. why do you think there is? see 1997 62.45F average temperature. 12 months of temps divided by 12. and we have an average. wow would you take a fken look at that?

BTW, 30 year average is 360 months of temps divided by 360 and again, would you take a fkn look, an average temp. now is that average value different than 1997? again, referencing 1997 to the 30 year average. baseline merely means month start to month end of the 360 months. that's it. so can you please learn something for us?
 
Last edited:
Even CF hasn't tried that lie!!!

From CF's OP graphic:

The global average temperature of 62.45 degrees Fahrenheit for 1997 was the warmest year on record, surpassing the previous record set in 1995 by 0.15 degrees Fahrenheit. The chart reflects variations from the 30-year average (1961-1990) of the combined land and sea surface temperatures.
and, I'm not stating anything different. you keep changing the 1997 average. you made it three different figures so far. All he and I are trying to show you is that 1997 average temp is 62.4. and that will never change. EVAH

BTW, do you understand that the average temperature for 1995 was 62.30F right?
Now you are back to playing dumb so you can keep on lying.
dude, stop flopping around. do you are do you not agree that the average temperature for 1997 was 62.45 F? I'll start there.
It is you flopping around because you got caught lying about the 1997 global temp "not using any baseline for anything."
what again does that mean? what is the definition of baseline? there is no baseline required to calculate a 12 month average temperature. why do you think there is? see 1997 62.45F average temperature. 12 months of temps divided by 12. and we have an average. wow would you take a fken look at that?
As has been already explained to you, and you said you understand the link provided 3 times that explains how global temps are measured. Were you lying then or are you lying now?

Explainer: How do scientists measure global temperature? | Carbon Brief

The basics
To get a complete picture of Earth’s temperature, scientists combine measurements from the air above land and the ocean surface collected by ships, buoys and sometimes satellites, too.

The temperature at each land and ocean station is compared daily to what is ‘normal’ for that location and time, typically the long-term average over a 30-year period. The differences are called an ‘anomalies’ and they help scientists evaluate how temperature is changing over time.

A ‘positive’ anomaly means the temperature is warmer than the long-term average, a ‘negative’ anomaly means it’s cooler.

Daily anomalies are averaged together over a whole month. These are, in turn, used to work out temperature anomalies from season-to-season and year-to-year.

After working out the annual temperature anomalies for each land or ocean station, the next job for scientists is to divide the earth up into grid boxes.

They work out the average temperature for each box by combining data from all the available stations. The smaller the grid boxes, the better the average temperature of the box will reflect the actual temperature at any given point, leading to a more accurate estimate global temperature when you add them all together.

By combining the grid boxes, scientists work out average temperatures for the northern and southern hemispheres. How much each box contributes to the global temperature is adjusted to account for the fact that the degree of longitude is bigger at the equator than at the poles. Together, the hemispheric values provide an estimate of global average temperature.
And? each daily value is a temperature set. and the anomaly is the difference between the temperature averaged over a 30 year period. So for 1997 the average temperature was 62.45F. agree or not?
Only when using the 30 year 1961-1990 global baseline. When using the 100 year 20th century global baseline the 1997 average global temperature is 57.92F.
Using either baseline 2015 was warmer than 1997. The only way to make 1997 "warmer" than 2015 is to dishonestly use a different baseline for each year.

Here is a chart using the 1961-1990 baseline for both years.

pr%202_1_0.png

Global annual average temperatures anomalies (relative to 1961-1990) based on an average of three global temperature data sets (HadCRUT.4.4.0.0, GISTEMP and NOAAGlobalTemp) from 1950 to 2015.
:lmao::lmao::lmao::lmao::lmao::lmao::lmao::lmao:
 
no the average temperature for 1997 was 62.4F. not using any baseline for anything. Why do you keep using baseline figures for 1997? It had an average temperature period. it was 62.4F. if the 20th century average temps was 56.9 then the anomaly/ difference is ~6 degree F. that's it. nothing gets converted or changed or anything. the anomaly is ~6. got it.
Even CF hasn't tried that lie!!!

From CF's OP graphic:

The global average temperature of 62.45 degrees Fahrenheit for 1997 was the warmest year on record, surpassing the previous record set in 1995 by 0.15 degrees Fahrenheit. The chart reflects variations from the 30-year average (1961-1990) of the combined land and sea surface temperatures.
and, I'm not stating anything different. you keep changing the 1997 average. you made it three different figures so far. All he and I are trying to show you is that 1997 average temp is 62.4. and that will never change. EVAH

BTW, do you understand that the average temperature for 1995 was 62.30F right?
Now you are back to playing dumb so you can keep on lying.
dude, stop flopping around. do you are do you not agree that the average temperature for 1997 was 62.45 F? I'll start there.

The el Nino of 97-98 caused a significant spike in global air and land temperatures and was followed by a lengthy la Nina event. Since then however, temperatures have continued to rise. 2005 was hotter than 1998, 2010 was hotter than 2005, 2015 was hotter than 2010 and 2016 is very likely to be hotter still.
well the deal is the question that I asked, and you didn't come near answering it. Was the temperature 62.45F in 1997 or not? Who cares why it was that temperature.

What is hilarious is you all pronounced that 2015 to 2016 was another el nino. So why wouldn't the temps have gone up? I don't know, you all just can't quite grasp how to discuss global warming.

So to summarize, the two hottest years were due to el nino and not CO2. just so you have that piece of information from this discussion.
 
The el Nino of 97-98 caused a significant spike in global air and land temperatures and was followed by a lengthy la Nina event. Since then however, temperatures have continued to rise. 2005 was hotter than 1998, 2010 was hotter than 2005, 2015 was hotter than 2010 and 2016 is very likely to be hotter still.

well the deal is the question that I asked, and you didn't come near answering it. Was the temperature 62.45F in 1997 or not? Who cares why it was that temperature.

What is hilarious is you all pronounced that 2015 to 2016 was another el nino. So why wouldn't the temps have gone up? I don't know, you all just can't quite grasp how to discuss global warming.

So to summarize, the two hottest years were due to el nino and not CO2. just so you have that piece of information from this discussion.

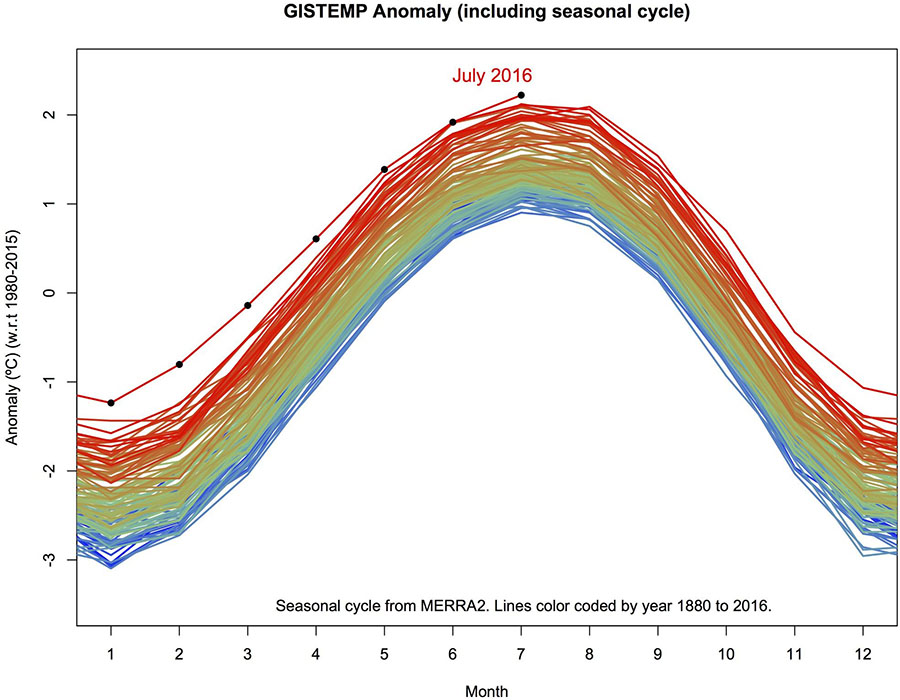
gistemp-anomaly.jpg


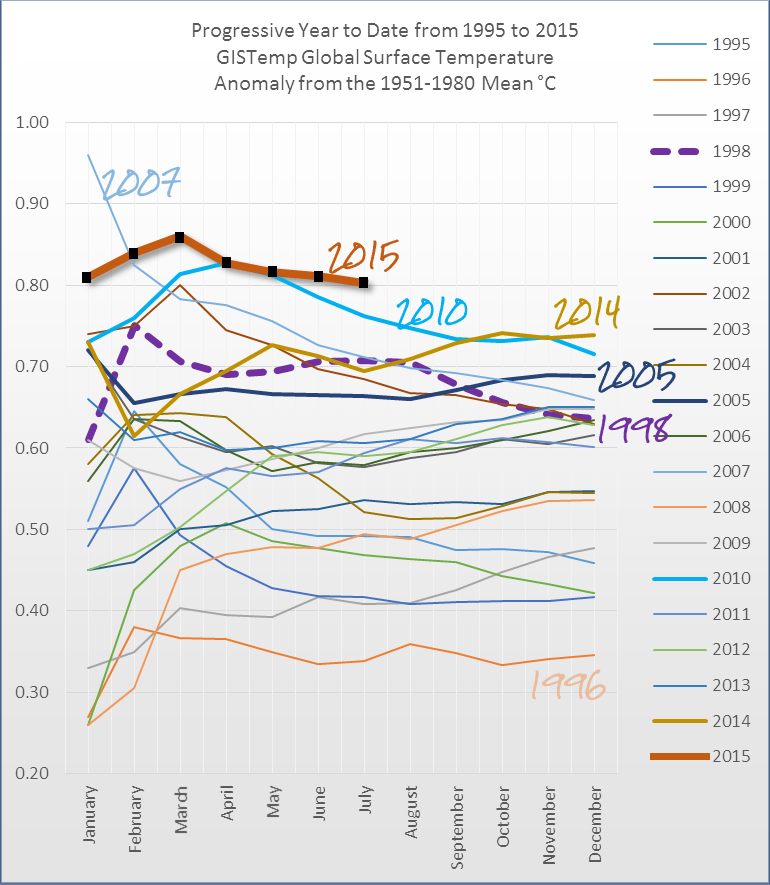
Or this one - a little easier to see where 97 and 98 fall

GISTemp%2Bglobal%2Bsurface%2Btemperature%2BYTD%2BJuly15.png

BS Graph that lowered 97 by 5F and uses the "deep ocean" warming to make up most of the "warming" from 2012-2015
 
The el Nino of 97-98 caused a significant spike in global air and land temperatures and was followed by a lengthy la Nina event. Since then however, temperatures have continued to rise. 2005 was hotter than 1998, 2010 was hotter than 2005, 2015 was hotter than 2010 and 2016 is very likely to be hotter still.

well the deal is the question that I asked, and you didn't come near answering it. Was the temperature 62.45F in 1997 or not? Who cares why it was that temperature.

What is hilarious is you all pronounced that 2015 to 2016 was another el nino. So why wouldn't the temps have gone up? I don't know, you all just can't quite grasp how to discuss global warming.

So to summarize, the two hottest years were due to el nino and not CO2. just so you have that piece of information from this discussion.

gistemp-anomaly.jpg


Or this one - a little easier to see where 97 and 98 fall

GISTemp%2Bglobal%2Bsurface%2Btemperature%2BYTD%2BJuly15.png
I love it. dude, I don't trust any graph you post. Everything to date that you've ever posted is adjusted crap. I asked a really simple question, which again you avoided answering. So you have no answer. just pretty little home made graphs of someone's opinion of what happened in the world. :lmao::lmao::lmao::lmao::lmao::lmao::lmao::lmao::lmao::lmao::link:
 
That was easy then, wasn't it. Precisely like the kid with his eyes clenched shut, fists in his ears chanting "nanny nanny nanny nanny nanny nanny..."
 

Forum List

Back
Top