No Great Depression 2.0

Toro

Diamond Member
Sep 29, 2005
106,647
41,431
2,250
Surfing the Oceans of Liquidity
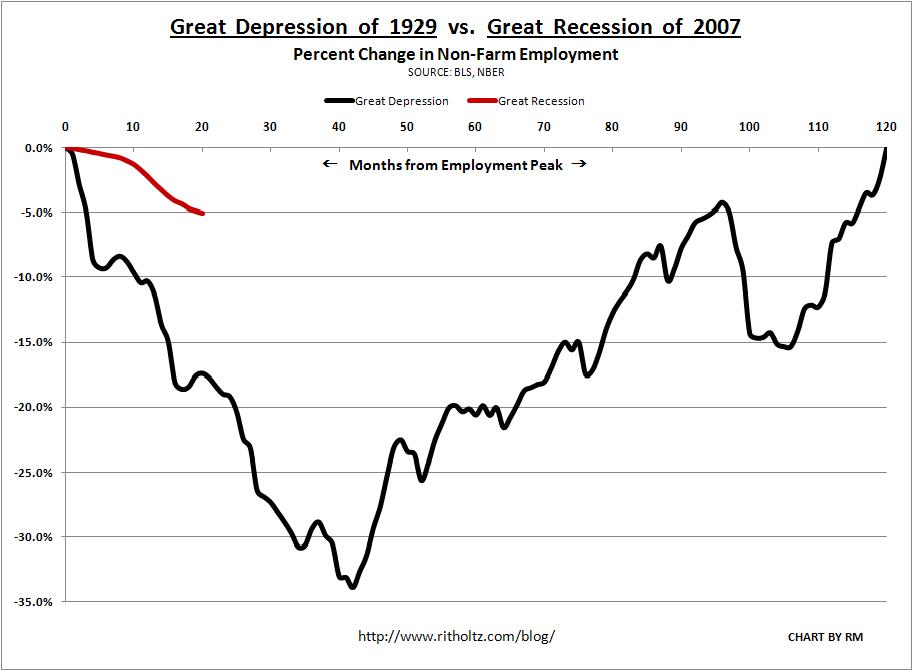
The rate of job loss is nowhere near the rate during the Depression.

1929-VS-2007.JPG


http://www.ritholtz.com/blog/2009/09/1929-versus-2007-employment-change/
 
Last edited:
The chart is totally bogus. If one were to use the unemployment counting means of the 1930's the unemployment fall off in 2008-9 has been far greater than 1929. Consider that unemployment now is between 10 and 20 percent. That does not show in the chart. Even the government with all of its lies admits that it is 9.7% NOT THE FIVE PERCENT DEPICTED.
 
Last edited:
In the depression, the unemployment rate reached 25 percent. We haven't had nearly the number of bank failures this time that we did in 1929.
 
The more people that believe the recession is over, the sooner the deflation can start. It is not going to be pretty......
 
The chart is totally bogus. If one were to use the unemployment counting means of the 1930's the unemployment fall off in 2008-9 has been far greater than 1929. Consider that unemployment now is between 10 and 20 percent. That does not show in the chart. Even the government with all of its lies admits that it is 9.7% NOT THE FIVE PERCENT DEPICTED.

Neubarth is completely bogus about the 1930s chart and has no empirical evidence for his claim about unemployment today. Let's move on.
 
In the depression, the unemployment rate reached 25 percent. We haven't had nearly the number of bank failures this time that we did in 1929.

You have to remember that the official unemployment rate and unofficial unemployment rate are different. The unofficial and the more real one is the true one. That one doesn't stop counting people after a period of time like the official numbers do. So unemployment and poverty are much higher than what is currently being said.
 
The chart is totally bogus. If one were to use the unemployment counting means of the 1930's the unemployment fall off in 2008-9 has been far greater than 1929. Consider that unemployment now is between 10 and 20 percent. That does not show in the chart. Even the government with all of its lies admits that it is 9.7% NOT THE FIVE PERCENT DEPICTED.

Neubarth is completely bogus about the 1930s chart and has no empirical evidence for his claim about unemployment today. Let's move on.


Boy are you stupid. I point out that the chart does not even agree with the Department of Labor and you say I have no empirical evidence. You have just won the title of the dumbest person to ever post on this board. Are you drunk? Hopped up on drugs? Insane?

I just have to give you a nickname for such a stupid post. How about DTS? We will pronounce it DITZ.....
That stands for Dumber Than Sheet.

In 2007 the unemployment rate (If you believe the totally bogus DOL numbers) was 4.4% Now it is 9.7% (and most intelligent people know that it is a lot higher than that.). Let's see, if we do some math and subtract 4.4 from 9.7% we end up with 5.3% which is a lot higher than the Graph would indicate.

Now, if we were counting the unemployed like they did in 1929, we would see that the chart would show a steeper fall off in unemployment than happened in the first year of the so called Great Depression.

It has started off worse than 1929, and is rapidly collapsing. Don't let any pathological liar tell you otherwise.
 
Last edited:
In the depression, the unemployment rate reached 25 percent. We haven't had nearly the number of bank failures this time that we did in 1929.

You have to remember that the official unemployment rate and unofficial unemployment rate are different. The unofficial and the more real one is the true one. That one doesn't stop counting people after a period of time like the official numbers do. So unemployment and poverty are much higher than what is currently being said.

that's true but I don't think the real rate is anywhere near 25 percent. and what method did they use in the 1930s?
 
Gosh, when the lefties were screaming at election time we were in a recession which was going to become a depression of depression era proportions they were WRONG. Just like they're WRONG about everything.

But never fear, their policies may yet make their dreams come true.
 
that's true but I don't think the real rate is anywhere near 25 percent. and what method did they use in the 1930s?

No, it's not near 25% at the moment. However, considering unemployment is about 10% nationally, I'd say its more 12-15% nationally. For states like Michigan where the unemployment rate is near 20% or at 20%, it's probably 25% or higher.

To address your question, there was no standard for tracking unemployment until 1940. So it's tough to say as there were various standards. However, it can be probably universally agreed that the U.S's entry into WWII definitely ended the Depression.

http://www.bls.gov/opub/hom/homch1_a.htm

Here you go Elvis, hope that helps.
 
Gosh, when the lefties were screaming at election time we were in a recession which was going to become a depression of depression era proportions they were WRONG. Just like they're WRONG about everything.

But never fear, their policies may yet make their dreams come true.

Actually, you're wrong but what else is new you moonbat. The traditional way that a depression is defined was fulfilled at this financial downturn's peak.
 
The chart is totally bogus. If one were to use the unemployment counting means of the 1930's the unemployment fall off in 2008-9 has been far greater than 1929. Consider that unemployment now is between 10 and 20 percent. That does not show in the chart. Even the government with all of its lies admits that it is 9.7% NOT THE FIVE PERCENT DEPICTED.

Its not the rate of unemployment. It is the rate of job loss in nonfarm employment.
 
If we run out of cash we can just print up some more. Just like North Korea, I've been printing my own dollars for years!:lol:
 
If we run out of cash we can just print up some more. Just like North Korea, I've been printing my own dollars for years!:lol:

Terral will be here in a minute to tell you we are headed for Weimar inflation followed by another Hitler.
 
In the depression, the unemployment rate reached 25 percent. We haven't had nearly the number of bank failures this time that we did in 1929.

You have to remember that the official unemployment rate and unofficial unemployment rate are different. The unofficial and the more real one is the true one. That one doesn't stop counting people after a period of time like the official numbers do. So unemployment and poverty are much higher than what is currently being said.

The easiest way to compare levels of employment across time periods is to look at the level of total employed relative to everyone who is employable. As you can see, even with this severe recession, it is still higher than it was at any time before 1975.

EMRATIO_Max_630_378.png


If this graph was extended to the 1930s, the ratio would be far lower during the Depression than the lows in this graph.

This is the productive capacity of labor. It represents the total amount of labor that can produce things. Because it is higher today, the economy is less reliant on a unit of labor compared to the past. That means that when someone loses their job - as bad as it is - it is not as bad as it was 40 years ago, let alone 75 years ago.

This is why this whole "the real level of unemployment is X%" argument is specious.
 
The chart is totally bogus. If one were to use the unemployment counting means of the 1930's the unemployment fall off in 2008-9 has been far greater than 1929. Consider that unemployment now is between 10 and 20 percent. That does not show in the chart. Even the government with all of its lies admits that it is 9.7% NOT THE FIVE PERCENT DEPICTED.

Its not the rate of unemployment. It is the rate of job loss in nonfarm employment.
Toro, you know like the rest of us that there was no accurate tracking of Job Loss in 1929. You also should know that the Federal numbers of the present time are totally bogus as they do not reflect self employed (who have supposedly left the work force) The lies of the DOL and Labor Statistics Clowns make a chart like that which you posted totally bogus as I originally stated.

The data are not viable.

The only thing that we can use are the unemployment numbers (which I refute, but are official) to look at people out of work for whatever reason. That number from Peak employment in 2007 was 4.4% and now is about 9.8% (But actually over 20%). That would give us 5.4%. If you want to accept the official Federal numbers, I'll grant you that the chart was close to accurate, but you have got to understand that in 1929 the number counting was far more accurate than today.

A chart like that which you posted is totally unreliable other than for entertainment purposes for dullards.
 
In the depression, the unemployment rate reached 25 percent. We haven't had nearly the number of bank failures this time that we did in 1929.

You have to remember that the official unemployment rate and unofficial unemployment rate are different. The unofficial and the more real one is the true one. That one doesn't stop counting people after a period of time like the official numbers do. So unemployment and poverty are much higher than what is currently being said.

The easiest way to compare levels of employment across time periods is to look at the level of total employed relative to everyone who is employable. As you can see, even with this severe recession, it is still higher than it was at any time before 1975.

EMRATIO_Max_630_378.png


If this graph was extended to the 1930s, the ratio would be far lower during the Depression than the lows in this graph.

This is the productive capacity of labor. It represents the total amount of labor that can produce things. Because it is higher today, the economy is less reliant on a unit of labor compared to the past. That means that when someone loses their job - as bad as it is - it is not as bad as it was 40 years ago, let alone 75 years ago.

This is why this whole "the real level of unemployment is X%" argument is specious.

I love this chart for only one purpose. Do you see the head and sholders that has formed? OMINOUS!!!!

That tells us that something BIG is going to happen soon. Hang on to your hats kids. This rollercoaster has just started its ride.
 
The chart is totally bogus. If one were to use the unemployment counting means of the 1930's the unemployment fall off in 2008-9 has been far greater than 1929.
You continue to confuse employment and unmployment. They are seperate things. There was no real method of counting unemployed in the 30's...the census was used, and there was a postcard survey in 1936, but no systematic measurement of unemployment. Employment had been tracked since 1915, and while not comprehensive, by 1932 it covered over a hundred industries. By 1936 the sample did cover all non-farm wage and salary employment.

Consider that unemployment now is between 10 and 20 percent. That does not show in the chart. Even the government with all of its lies admits that it is 9.7% NOT THE FIVE PERCENT DEPICTED.

The 5% is NET JOB LOSS, NOT UNEMPLOYMENT. Learn the difference. One more time, job loss (or gain) is the difference between the number of non-farm payroll jobs (people holding multiple jobs are counted for each job) and Unemployment is the number of people without work actively looking for work. Completely different, non-comparable, things.

You also should know that the Federal numbers of the present time are totally bogus as they do not reflect self employed
Yes, they do. They are included in the household survey, and always have been.
 
Last edited:
The chart is totally bogus. If one were to use the unemployment counting means of the 1930's the unemployment fall off in 2008-9 has been far greater than 1929. Consider that unemployment now is between 10 and 20 percent. That does not show in the chart. Even the government with all of its lies admits that it is 9.7% NOT THE FIVE PERCENT DEPICTED.

The chart isn't saying unemployment is five percent. It's say employment has declined by five percent from peak.
 
Last edited:

Forum List

Back
Top