New Year’s Resolutions For Climate Scientists

You retards are too stupid to see that 'your' so-called opinions are nothing but misinformation and lies and they were indeed "handed" to you by the clever propagandists working for the fossil fuel industry.
Sure thing dearie. Here's what your side had to say about the sea ice this year and here is the graph showing the real world. Notice a little problem there? Nah? I didn't think you would.

"The Arctic ice cap freezes each winter as the sun sets for months at a time below the horizon. It swiftly melts each summer as the sun rises higher in the warming northern sky. Each year the sea ice reaches its annual minimum melt extent in September, but hit a record low in 2007. This year the Arctic Sea ice melted to its second lowest extent in recorded human history. Unprecedented amounts of new data shows that this trend is accelerating."

Arctic Watch iOS Released - Second largest ice melt in recorded history

LOLOL....you are such a silly moron, walleyed....your link leads to an ad for an iphone app with a few lines about the Arctic quoted from somewhere....the info is accurate though.....even though you're far too brainwashed and retarded to accept the scientific evidence....you poor, poor fool....your own 'thumbnail' attachment was un-sourced and not linked so who knows what the context was or who produced it....here's the actual look of the long term trend.....too bad you have your head jammed so far up your ass that you'll never be able to comprehend this whole issue....here's an important sentence from your link that you should have included: "NSIDC Director Mark Serreze said, "It looks like the spring ice cover is so thin now that large areas melt out in summer, even without persistent extreme weather patterns.""


ssmi_mdev_ice-area.png

Monthly Deviations of Sea Ice Area in the Arctic from merged SMMR and SSMI Data (NORSEX algorithm) (Copyright: NERSC and NIERSC)
Arctic Regional Ocean Observing System

(In accordance with Title 17 U.S.C. Section 107, this material is distributed without profit to those who have expressed a prior interest in receiving the included information for research and educational purposes.)


Not too observant are you. Try the link again moron.
 
Sure thing dearie. Here's what your side had to say about the sea ice this year and here is the graph showing the real world. Notice a little problem there? Nah? I didn't think you would.

"The Arctic ice cap freezes each winter as the sun sets for months at a time below the horizon. It swiftly melts each summer as the sun rises higher in the warming northern sky. Each year the sea ice reaches its annual minimum melt extent in September, but hit a record low in 2007. This year the Arctic Sea ice melted to its second lowest extent in recorded human history. Unprecedented amounts of new data shows that this trend is accelerating."

Arctic Watch iOS Released - Second largest ice melt in recorded history

LOLOL....you are such a silly moron, walleyed....your link leads to an ad for an iphone app with a few lines about the Arctic quoted from somewhere....the info is accurate though.....even though you're far too brainwashed and retarded to accept the scientific evidence....you poor, poor fool....your own 'thumbnail' attachment was un-sourced and not linked so who knows what the context was or who produced it....here's the actual look of the long term trend.....too bad you have your head jammed so far up your ass that you'll never be able to comprehend this whole issue....here's an important sentence from your link that you should have included: "NSIDC Director Mark Serreze said, "It looks like the spring ice cover is so thin now that large areas melt out in summer, even without persistent extreme weather patterns.""


ssmi_mdev_ice-area.png

Monthly Deviations of Sea Ice Area in the Arctic from merged SMMR and SSMI Data (NORSEX algorithm) (Copyright: NERSC and NIERSC)
Arctic Regional Ocean Observing System

(In accordance with Title 17 U.S.C. Section 107, this material is distributed without profit to those who have expressed a prior interest in receiving the included information for research and educational purposes.)
Not too observant are you. Try the link again moron.
Hey nitwit, how can you fail to "observe" that the one and only link in your post ("Arctic Watch iOS Released - Second largest ice melt in recorded history") leads directly to a page that, except for the one paragraph you quoted, is only a plug for an iphone app...LOL...I guess you're just too retarded to find a direct source for the current Arctic ice info....so where did you scrape up that link from?....copied from some half-witted denier cult blog using it in the usual futile attempt to deny the facts about the Arctic melt, perhaps?....is that where you copied your un-sourced graph from too?....

Arctic Watch iOS Released - Second largest ice melt in recorded history

Sausalito, CA Dec 20, 2011 in Utilities

[prMac.com] Sausalito, California - Press Start Studios today is pleased to announce the release and immediate availability of Arctic Watch 1.98 for iPhone and iPad. Arctic Watch aims to raise awareness about the Arctic, with access to daily measurements taken from NASA's earth orbiting satellite systems.

***

Arctic Watch for iOS is an interactive map of satellite photos that highlight the seasonal ice melt of the north and south pole. It utilizes the NASA Aqua satellite system to retrieve daily updates, and incorporate them into charts and animations that allow you to see trends extending back as far as 30 years.

Arctic Watch is shedding new light on earth science in a way that is accessible for kids and adults. The app is translated in over 13 international languages, and has been adopted in innovative new science programs in Canada, Russia and the US.

Device Requirements:
* iPhone, iPod touch and iPad
* Requires iPhone OS 3.0 or later
* 3.2 MB

Pricing and Availability:
Arctic Watch 1.98 is free and available worldwide exclusively through the App Store in the Utilities category. Arctic Watch Pro is available for $0.99 (USD) cents.
Arctic Watch 1.98
Download From iTunes
YouTube Video
Screenshot A
Screenshot B
App Icon

Headquartered in the Bay Area's beautiful city of Sausalito, Press Start Studios is a premier Mac and PC development firm. Press Start is a small but passionate vision about software, design, and innovation. Press Start is committed to helping the community, and carefully reviews all user feedback. The company aims to create software that is simpler, more user friendly, and more valuable than ever before. For more information on Press Start, visit the arctic watch home page. Copyright (C) 2011 Press Start Studios. All Rights Reserved. Apple, the Apple logo, and Macintosh are registered trademarks of Apple Inc. in the U.S. and/or other countries.

###
Adam Piper
CEO

© 2007-2012 prMac and GeekSuit, LLC

(In accordance with Title 17 U.S.C. Section 107, this material is distributed without profit to those who have expressed a prior interest in receiving the included information for research and educational purposes.)


So ummmm.........whats the point exactly Nitz?:D Might as well be posting up Cribbage strategy s0n!!

4141033833_30d6613200_z.jpg


Only the social invalid OCD k00ks out in the nether regions of the internet are talking about ice melt these days. Nobody else.
 
Last edited:
You retards are too stupid to see that 'your' so-called opinions are nothing but misinformation and lies and they were indeed "handed" to you by the clever propagandists working for the fossil fuel industry.


The thing is this: You are on the side that asserts a particular problem with a particular cause and a particular solution.

It is your job to prove it. You have not.
Remember, we're dealing with people who really do think their feelings define reality.

Reality, however, refuses to cooperate.
Keep parroting those cliched CON$ervative talking points like a good little sheeple.
I notice you can't seem to offer a logical counter-argument.

But then, leftists don't do logic.
 
The thing is this: You are on the side that asserts a particular problem with a particular cause and a particular solution.

It is your job to prove it. You have not.
Remember, we're dealing with people who really do think their feelings define reality.

Reality, however, refuses to cooperate.
Keep parroting those cliched CON$ervative talking points like a good little sheeple.


s0n.........not for nothing but the environmental radicals like you and the other k00ks in this forum are getting your clocks cleaned these days. Even Old Rocks conceeds this. Who gives a rats ass about a "solution"? Nobody in congress is touching this stuff with a ten foot poll lest he get his ass thrown the fcukk out. So ummmm............conservative talking points ftmfw!!!:D
 
Remember, we're dealing with people who really do think their feelings define reality.

Reality, however, refuses to cooperate.
Keep parroting those cliched CON$ervative talking points like a good little sheeple.
I notice you can't seem to offer a logical counter-argument.

But then, leftists don't do logic.
YOU need an argument, not a cliche, FIRST before someone can offer a counter argument.

Now when another poster said that we have been cooling for at least the last decade, I gave logic and more importantly data that proved the opposite. You then chimed in with nothing but cliched CON$ervative talking points. no logic no data no thought.
Sheer projection.
OK, show where you made a claim like in the OP that the globe has been cooling for at least the last decade, rather than your usual moronic cliches like Libs are emotional.


Here's the raw satellite data that shows no warming in the Arctic for the last seven years. It's basically flatlined. I suggest you take it up with them.

2003 1 0.443 0.539 0.654 0.109 0.846 0.510 1.030 0.615 0.264
2003 2 0.319 0.615 0.078 0.238 0.182 0.145 -0.719 0.283 0.357
2003 3 0.232 0.353 0.165 0.165 0.551 0.045 0.316 0.244 0.220
2003 4 0.295 0.330 0.453 0.087 0.868 0.257 0.536 0.419 0.165
2003 5 0.346 0.306 0.577 0.145 0.589 -0.735 0.310 0.499 0.186
2003 6 0.142 0.068 0.334 0.021 0.414 -0.524 -0.211 0.223 0.057
2003 7 0.281 0.320 0.308 0.207 0.720 -0.391 0.831 0.289 0.272
2003 8 0.276 0.284 0.497 0.029 1.197 0.482 1.080 0.420 0.125
2003 9 0.323 0.254 0.621 0.082 1.090 0.410 -0.087 0.494 0.143
2003 10 0.434 0.453 0.715 0.110 1.544 -0.600 1.174 0.627 0.231
2003 11 0.350 0.456 0.532 0.035 1.025 -0.176 0.301 0.504 0.190
2003 12 0.447 0.367 0.778 0.183 1.074 0.089 0.570 0.617 0.268
2004 1 0.316 0.412 0.202 0.328 0.554 0.110 -0.007 0.263 0.372
2004 2 0.324 0.371 0.615 -0.041 0.229 0.130 -0.197 0.570 0.066
2004 3 0.439 0.355 0.827 0.120 0.140 0.051 1.918 0.681 0.187
2004 4 0.271 0.188 0.468 0.153 1.003 -0.262 0.672 0.371 0.165
2004 5 0.154 0.129 0.374 -0.053 0.613 -0.386 0.524 0.309 -0.009
2004 6 0.097 -0.044 0.101 0.254 0.278 0.032 -0.536 0.047 0.150
2004 7 -0.002 -0.052 -0.012 0.067 0.191 -0.875 -0.351 -0.028 0.025
2004 8 0.081 0.202 0.081 -0.057 0.498 -0.226 -1.232 0.128 0.033
2004 9 0.204 0.065 0.290 0.271 0.205 0.006 0.126 0.198 0.211
2004 10 0.277 0.283 0.307 0.240 0.292 -0.120 0.150 0.283 0.271
2004 11 0.213 0.337 0.408 -0.138 0.244 -0.068 0.529 0.379 0.038
2004 12 0.122 0.361 0.037 -0.060 -0.543 0.112 0.269 0.140 0.103
2005 1 0.434 0.439 0.662 0.183 1.613 0.308 1.442 0.565 0.297
2005 2 0.343 0.715 0.069 0.210 1.168 -0.211 0.965 0.310 0.377
2005 3 0.319 0.591 0.416 -0.094 0.960 -0.056 -0.607 0.501 0.129
2005 4 0.481 0.498 0.751 0.173 1.241 0.128 0.368 0.677 0.275
2005 5 0.287 0.244 0.273 0.351 1.301 0.283 -0.628 0.264 0.311
2005 6 0.259 0.323 0.453 -0.022 0.816 0.298 0.405 0.401 0.110
2005 7 0.358 0.427 0.541 0.083 0.553 -0.122 1.049 0.483 0.227
2005 8 0.260 0.303 0.443 0.016 0.651 0.497 0.381 0.381 0.134
2005 9 0.400 0.369 0.607 0.215 0.338 -0.066 0.912 0.532 0.263
2005 10 0.384 0.211 0.720 0.222 1.127 0.504 0.735 0.524 0.237
2005 11 0.327 0.296 0.567 0.104 1.594 0.010 0.984 0.473 0.174
2005 12 0.157 0.186 0.291 -0.019 1.764 0.508 -0.446 0.264 0.045
2006 1 0.233 0.157 0.235 0.318 0.074 0.117 2.524 0.229 0.236
2006 2 0.248 0.340 0.383 -0.002 0.795 -0.049 -0.488 0.378 0.112
2006 3 0.256 0.049 0.493 0.238 0.738 -0.032 -0.268 0.319 0.189
2006 4 0.235 -0.013 0.450 0.290 -0.084 0.427 1.886 0.303 0.165
2006 5 0.071 -0.118 0.432 -0.098 0.863 -0.538 0.656 0.261 -0.128
2006 6 0.166 0.070 0.493 -0.075 0.791 -0.142 0.815 0.334 -0.010
2006 7 0.229 0.298 0.317 0.056 0.268 -0.485 1.370 0.313 0.141
2006 8 0.231 0.239 0.396 0.046 0.688 -0.059 0.354 0.325 0.133
2006 9 0.317 0.166 0.629 0.157 1.662 -0.033 -1.163 0.460 0.167
2006 10 0.316 0.362 0.342 0.236 0.447 0.225 -1.052 0.342 0.289
2006 11 0.194 0.212 0.293 0.069 0.854 0.118 0.671 0.243 0.143
2006 12 0.288 0.424 0.455 -0.047 1.358 -0.400 1.071 0.442 0.127
2007 1 0.545 0.613 0.867 0.123 0.953 0.093 0.376 0.760 0.320
2007 2 0.333 0.442 0.466 0.067 0.511 -0.096 -1.070 0.473 0.188
2007 3 0.348 0.240 0.661 0.136 0.452 -0.053 2.455 0.534 0.153
2007 4 0.296 0.185 0.660 0.035 2.175 0.120 -0.031 0.500 0.083
2007 5 0.183 0.200 0.385 -0.052 0.051 -0.114 0.944 0.338 0.020
2007 6 0.196 0.189 0.466 -0.084 1.048 0.327 0.667 0.357 0.028
2007 7 0.261 0.302 0.452 0.012 1.018 0.344 0.868 0.395 0.122
2007 8 0.317 0.126 0.563 0.272 0.916 0.153 1.165 0.375 0.255
2007 9 0.250 0.179 0.445 0.123 0.118 -0.799 0.500 0.328 0.168
2007 10 0.215 0.003 0.491 0.161 0.962 -0.195 1.195 0.299 0.127
2007 11 0.126 0.012 0.286 0.086 0.729 0.532 0.502 0.172 0.078
2007 12 0.063 -0.153 0.126 0.243 0.926 0.022 -0.290 0.037 0.090
2008 1 -0.106 -0.213 -0.134 0.047 0.172 -0.563 -0.727 -0.174 -0.035
2008 2 -0.058 -0.299 0.206 -0.064 -0.032 -0.399 -0.095 0.035 -0.155
2008 3 0.044 -0.430 0.832 -0.255 0.142 -0.506 -0.740 0.428 -0.357
2008 4 0.026 -0.399 0.727 -0.237 0.319 0.365 -0.052 0.359 -0.321
2008 5 -0.129 -0.424 0.313 -0.264 1.247 0.408 -0.350 0.081 -0.349
2008 6 -0.030 -0.212 0.216 -0.084 0.279 -0.825 0.027 0.057 -0.120
2008 7 0.079 -0.035 0.322 -0.053 0.362 0.187 0.292 0.173 -0.021
2008 8 0.065 -0.050 0.360 -0.119 0.709 -0.059 0.138 0.185 -0.061
2008 9 0.181 0.126 0.273 0.148 0.624 0.148 -0.223 0.205 0.157
2008 10 0.179 0.173 0.390 -0.041 0.479 -0.693 0.026 0.282 0.071
2008 11 0.216 0.180 0.317 0.151 0.701 0.142 0.401 0.265 0.166
2008 12 0.149 0.049 0.373 0.025 1.030 -0.358 -0.624 0.253 0.041
2009 1 0.252 0.016 0.539 0.215 1.024 -0.122 0.279 0.338 0.162
2009 2 0.193 0.105 0.432 0.038 -0.561 -0.459 0.320 0.339 0.039
2009 3 0.153 -0.053 0.427 0.096 -0.263 0.364 0.609 0.237 0.065
2009 4 0.171 0.140 0.318 0.049 0.596 -0.554 -0.073 0.260 0.078
2009 5 0.056 0.035 0.123 0.008 0.358 0.336 0.444 0.106 0.004
2009 6 0.018 0.157 -0.090 -0.025 0.149 0.424 -0.266 -0.005 0.042
2009 7 0.329 0.528 0.068 0.382 0.208 0.926 -0.677 0.223 0.440
2009 8 0.242 0.467 0.215 0.015 0.245 0.361 -0.057 0.316 0.165
2009 9 0.470 0.597 0.569 0.218 0.904 0.004 0.645 0.593 0.341
2009 10 0.299 0.418 0.243 0.222 0.679 0.081 -1.610 0.317 0.279
2009 11 0.328 0.493 0.272 0.199 0.251 0.593 1.398 0.332 0.324
2009 12 0.204 0.534 0.026 0.019 1.536 -0.316 -1.929 0.206 0.203
2010 1 0.597 0.732 0.665 0.370 1.411 0.308 0.030 0.723 0.465
2010 2 0.524 0.965 0.183 0.382 0.693 0.354 -1.997 0.479 0.570
2010 3 0.598 0.834 0.621 0.302 0.670 0.061 0.417 0.716 0.474
2010 4 0.505 0.764 0.607 0.099 1.799 -0.441 0.715 0.682 0.319
2010 5 0.531 0.782 0.653 0.114 2.078 -0.578 -0.381 0.730 0.324
2010 6 0.494 0.491 0.642 0.340 0.549 -0.485 0.825 0.563 0.423
2010 7 0.564 0.444 0.872 0.373 0.984 -0.552 0.841 0.693 0.430
2010 8 0.553 0.382 0.973 0.299 1.217 -0.314 1.096 0.743 0.354
2010 9 0.509 0.255 0.745 0.547 0.986 0.583 0.632 0.530 0.487
2010 10 0.301 0.138 0.397 0.385 1.123 0.352 0.494 0.289 0.314
2010 11 0.315 -0.068 0.688 0.355 1.191 0.126 0.021 0.418 0.208
2010 12 0.220 -0.225 0.472 0.461 1.403 0.162 -0.853 0.230 0.210
2011 1 0.085 -0.300 0.211 0.389 1.803 -0.101 -0.792 0.041 0.130
2011 2 0.051 -0.222 0.054 0.360 -0.104 -0.587 -0.556 -0.012 0.116
2011 3 -0.028 -0.285 0.212 0.009 1.387 0.095 0.070 0.056 -0.116
2011 4 0.105 -0.157 0.366 0.128 0.561 0.084 0.128 0.207 -0.001
2011 5 0.125 -0.026 0.231 0.183 0.811 -0.171 -0.467 0.173 0.074
2011 6 0.297 0.167 0.468 0.263 0.893 0.430 0.523 0.373 0.218
2011 7 0.328 0.234 0.538 0.211 0.583 0.606 1.425 0.414 0.237
2011 8 0.286 0.212 0.564 0.073 0.759 0.689 1.184 0.432 0.133
2011 9 0.287 0.155 0.520 0.189 1.000 0.924 0.255 0.381 0.189
2011 10 0.089 -0.061 0.356 -0.025 0.632 0.130 -0.077 0.205 -0.032
2011 11 0.033 0.025 0.113 -0.042 0.605 -0.016 0.327 0.083 -0.019


http://www.remss.com/data/msu/month...hannel_TLT_Anomalies_Land_and_Ocean_v03_3.txt
 
Sheer projection.
OK, show where you made a claim like in the OP that the globe has been cooling for at least the last decade, rather than your usual moronic cliches like Libs are emotional.
Here's the raw satellite data that shows no warming in the Arctic for the last seven years. It's basically flatlined. I suggest you take it up with them.
This is typical of the level of "logic" employed by CON$. The Arctic is now the whole globe if it supports global cooling. But the Arctic will not be the globe if it shows warming.

ClimateWatch Magazine » Arctic Warming Exceeds Global Average

This past year (October 2010-September 2011), surface temperatures in the Arctic were 1.5 degrees Celsius warmer than average. The image above shows where average air temperatures were up to 3 degrees Celsius above (red) or below (blue) the long-term average (1981-2010).

The Arctic’s 1.5-degree surface temperature anomaly was larger than the global average anomaly. This difference confirms what global climate models were projecting as far back as thirty years ago: that the Arctic region would warm faster than the rest of the planet due to long-term climate change.

The past six years in the northern polar region (above 60°N in the Northern Hemisphere) have been the warmest in the historical record. The city of Barrow, located in the northernmost region of Alaska, had a record summer run of 86 consecutive days with minimum temperatures at or above freezing beginning on June 30. The previous record was 68 days set in 2009. The city of Fairbanks may be experiencing record-breaking frigid temperatures in recent weeks, but last year, the city experienced its first fall freeze more than two weeks later than its long-term average—for the sixth consecutive year.
 
Hmmmm...... Arctic Ocean clathrates starting to outgas on a massive scale, the ice extant tied with 2007 for the lowest on record, and the volume is the lowest on record. Melting of the permafrost increasing in depth, and more CO2 and CH4 measured in the atmosphere above that area. But the area is either cooling or flatlined?

Just the normal lies and silliness. The people who have investigated the Arctic for more than two decades are flat stating that we have either passed the tipping point, or are right at it.
 
OK, show where you made a claim like in the OP that the globe has been cooling for at least the last decade, rather than your usual moronic cliches like Libs are emotional.
Here's the raw satellite data that shows no warming in the Arctic for the last seven years. It's basically flatlined. I suggest you take it up with them.
This is typical of the level of "logic" employed by CON$. The Arctic is now the whole globe if it supports global cooling. But the Arctic will not be the globe if it shows warming.

ClimateWatch Magazine » Arctic Warming Exceeds Global Average

This past year (October 2010-September 2011), surface temperatures in the Arctic were 1.5 degrees Celsius warmer than average. The image above shows where average air temperatures were up to 3 degrees Celsius above (red) or below (blue) the long-term average (1981-2010).

The Arctic’s 1.5-degree surface temperature anomaly was larger than the global average anomaly. This difference confirms what global climate models were projecting as far back as thirty years ago: that the Arctic region would warm faster than the rest of the planet due to long-term climate change.

The past six years in the northern polar region (above 60°N in the Northern Hemisphere) have been the warmest in the historical record. The city of Barrow, located in the northernmost region of Alaska, had a record summer run of 86 consecutive days with minimum temperatures at or above freezing beginning on June 30. The previous record was 68 days set in 2009. The city of Fairbanks may be experiencing record-breaking frigid temperatures in recent weeks, but last year, the city experienced its first fall freeze more than two weeks later than its long-term average—for the sixth consecutive year.


Ummmm, I hate to point out a fact to one such as you...but it is YOUR side that claims the Arctic is the "canary in the coal mine".

Take it up with your high priests.:eusa_pray:

"Arctic Is the Canary in the Coalmine
By Stephen Leahy

QUEBEC CITY, Canada, Dec 12, 2008 (IPS) - Nearly 1,000 scientists and representatives of indigenous peoples from 16 countries have braved a major winter storm to share their findings and concerns about the rapidly warming Arctic region at the International Arctic Change conference in Quebec City.

The Arctic is "ground zero" for climate change, with temperatures rising far faster than anywhere else on the planet. Some predict an ice-free summer Arctic in less than five to 10 years - the first time the Arctic Ocean will be exposed to the sun in many hundreds of thousands of years.

The speed of change has scientists scrambling to understand the impacts on indigenous people, wildlife and ecology.

"The Arctic will be full of future surprises," said David Carlson, an oceanographer and director of the International Polar Year programme office.

"Protected by its cover of sea ice, the Arctic Ocean is the last unblemished ocean on the planet," Carlson told IPS."


CLIMATE CHANGE: Arctic Is the Canary in the Coalmine - IPS ipsnews.net
 
Hmmmm...... Arctic Ocean clathrates starting to outgas on a massive scale, the ice extant tied with 2007 for the lowest on record, and the volume is the lowest on record. Melting of the permafrost increasing in depth, and more CO2 and CH4 measured in the atmosphere above that area. But the area is either cooling or flatlined?

Just the normal lies and silliness. The people who have investigated the Arctic for more than two decades are flat stating that we have either passed the tipping point, or are right at it.


Hmmm, massive clathrate venting due to sea water inundation 8,000YEARS ago!

But don't let facts get in the way of your hysteria there olfraud.
 
Home

Real scientists with real concerns, not internet wannabees.

So ocean inundation of the clathrates 8000 years ago is causing massive outgassing at just the time that the sea ice is disappearing at present. We have good record of the amount of CH4 in the atmosphere for the last 8000 years and it has never been above 1000 ppb, let alone 1800 ppb. And rising more rapidly now.
 
Arctic Sea Ice Gone in Summer Within Five Years?

Just last year two top scientists surprised their colleagues by projecting that the Arctic sea ice was melting so rapidly that it could disappear entirely by the summer of 2040.

This week, after reviewing his own new data, NASA climate scientist Jay Zwally said: "At this rate, the Arctic Ocean could be nearly ice-free at the end of summer by 2012, much faster than previous predictions."

So scientists in recent days have been asking themselves these questions: Was the record melt seen all over the Arctic in 2007 a blip amid relentless and steady warming? Or has everything sped up to a new climate cycle that goes beyond the worst case scenarios presented by computer models?

"The Arctic is often cited as the canary in the coal mine for climate warming," said Zwally, who as a teenager hauled coal. "Now as a sign of climate warming, the canary has died. It is time to start getting out of the coal mines."
 
Home

Real scientists with real concerns, not internet wannabees.

So ocean inundation of the clathrates 8000 years ago is causing massive outgassing at just the time that the sea ice is disappearing at present. We have good record of the amount of CH4 in the atmosphere for the last 8000 years and it has never been above 1000 ppb, let alone 1800 ppb. And rising more rapidly now.


OH MY GOD!!!!
Just look at the headline!

"ARCTIC SUMMER SEA ICE COULD BE GONE BY 2015"

But, but , but, but hey ...wait a minute. The sea ice data shows something entirely different.... So what does this make olfraud...tipping point number 3,022?

AND DON'T FORGET, THE METHANE IS VENTING BECAUSE OF SEA WATER INUNDATION FROM 8,000 YEARS AGO!
 

Attachments

  • $ssmi1_ice_ext.png
    $ssmi1_ice_ext.png
    32.9 KB · Views: 80
Last edited:
Arctic Sea Ice Gone in Summer Within Five Years?

Just last year two top scientists surprised their colleagues by projecting that the Arctic sea ice was melting so rapidly that it could disappear entirely by the summer of 2040.

This week, after reviewing his own new data, NASA climate scientist Jay Zwally said: "At this rate, the Arctic Ocean could be nearly ice-free at the end of summer by 2012, much faster than previous predictions."

So scientists in recent days have been asking themselves these questions: Was the record melt seen all over the Arctic in 2007 a blip amid relentless and steady warming? Or has everything sped up to a new climate cycle that goes beyond the worst case scenarios presented by computer models?

"The Arctic is often cited as the canary in the coal mine for climate warming," said Zwally, who as a teenager hauled coal. "Now as a sign of climate warming, the canary has died. It is time to start getting out of the coal mines."


Wow, looky there, Nat Geo was reporting that Arctic ice "could" (there's that magical word again) be gone in 5 years!:eek::eek::eek: So, that article is from 2007 (the lowest ice cover recorded in the whole 30 years that they have been actually recording it:cuckoo:
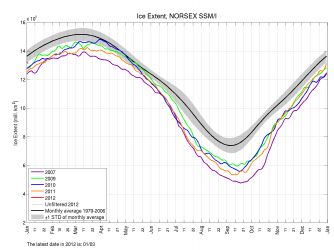
) and looky here, it's 2012 and there is more ice then in the previous 6 years!

WHOOOPS!

I wonder, can you guys ever get anything right?
 
YOU need an argument, not a cliche, FIRST before someone can offer a counter argument.

Now when another poster said that we have been cooling for at least the last decade, I gave logic and more importantly data that proved the opposite. You then chimed in with nothing but cliched CON$ervative talking points. no logic no data no thought.
Sheer projection.
OK, show where you made a claim like in the OP that the globe has been cooling for at least the last decade, rather than your usual moronic cliches like Libs are emotional.
I have made no claims about the climate.

You and your fellow cultists have, and so the burden of proof is on you to support your claims.

You have not done so with the scientific method.
 

Forum List

Back
Top