New Study: Sun controls climate, not CO2!!!

skookerasbil

Platinum Member
Aug 6, 2009
37,962
6,380
1,140
Not the middle of nowhere
Ummmm...........duh!!! !:up::eusa_dance::eusa_dance:


Summary >>>

A paper published today in Journal of Atmospheric and Solar-Terrestrial Physics finds a "strong and stable correlation" between the millennial variations in sunspots and the temperature in Antarctica over the past 11,000 years. In stark contrast, the authors find no strong or stable correlation between temperature and CO2 over that same period.


and from the authors >>>


"We find that the variations of SSN [sunspot number] and T [temperature] have some common periodicities, such as the 208 year (yr), 521 yr, and ~1000 yr cycles. The correlations between SSN and T are strong for some intermittent periodicities. However, the wavelet analysis demonstrates that the relative phase relations between them usually do not hold stable except for the millennium-cycle component. The millennial variation of SSN leads that of T by 30–40 years, and the anti-phase relation between them keeps stable nearly over the whole 11,000 years of the past. As a contrast, the correlations between CO2 and T are neither strong nor stable."


New paper finds strong evidence the Sun has controlled climate over the past 11 000 years not CO2 Principia Scientific Intl


In other words............"climate science" as it has become to be known, is a rigged fraud......like skeptics have been saying in here for a long, long time!!


Now........watch the handfull of AGW nutters fly into this thread and fall all over themselves calling BS!!!! Because, after all,...........gotta keep that established narrative in perpetual mode.........:funnyface::funnyface::fu:
 
A lot of things control the climate, including the type of plants and the condition of the soil. Have you ever heard of the dust bowl?

dust-bowl-cause-1.jpg


The Dust Bowl, also known as the Dirty Thirties, was a period of severe dust storms that greatly damaged the ecology and agriculture of the US and Canadian prairies during the 1930s; severe drought and a failure to apply dryland farming methods to prevent wind erosion (the Aeolian processes) caused the phenomenon.

Dust Bowl - Wikipedia the free encyclopedia


One of the problems in trying to decipher actual studies, is that scientist tend to have their own language when relating findings and it tends to cause a bit of confusion - like the infamous emails that spoke of "tricking," remember?

Question for the OP:

Are "sunspots" causing our current warming trend?
 
Last edited:
A lot of things control the climate, including the type of plants and the condition of the soil. Have you ever heard of the dust bowl?

dust-bowl-cause-1.jpg


The Dust Bowl, also known as the Dirty Thirties, was a period of severe dust storms that greatly damaged the ecology and agriculture of the US and Canadian prairies during the 1930s; severe drought and a failure to apply dryland farming methods to prevent wind erosion (the Aeolian processes) caused the phenomenon.

Dust Bowl - Wikipedia the free encyclopedia


One of the problems in trying to decipher actual studies, is that scientist tend to have their own language when relating findings and it tends to cause a bit of confusion - like the infamous emails that spoke of "tricking," remember?

Question for the OP:

Are "sunspots" causing our current warming trend?


Well.........actually, who the hell knows?

The answer is........nobody.......although I must point out that warming stopped 18 years ago now.:2up:
 
Well.........actually, who the hell knows?

The answer is........nobody.......although I must point out that warming stopped 18 years ago now.:2up:

I see, so the polar ice is melting, because....?

How can you honestly state that the warming has stopped 18 years ago? Are you using Joe Arpaio's guide to weather systems?


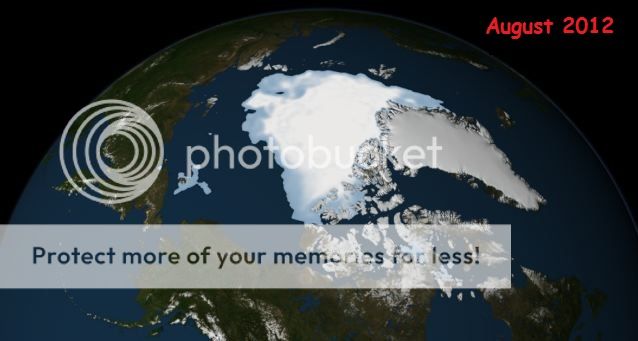
Ummm...........actually, it doubled in size last year.................

[URL=http://s42.photobucket.com/user/baldaltima/media/article-2415191-1BAED746000005DC-112_638x341-1.jpg.html][/URL]

[URL=http://s42.photobucket.com/user/baldaltima/media/article-2415191-1BAED742000005DC-727_638x345-1.jpg.html][/URL]


:oops-28::eusa_dance::eusa_dance::eusa_dance::eusa_dance:
 
A lot of things control the climate, including the type of plants and the condition of the soil. Have you ever heard of the dust bowl?

dust-bowl-cause-1.jpg


The Dust Bowl, also known as the Dirty Thirties, was a period of severe dust storms that greatly damaged the ecology and agriculture of the US and Canadian prairies during the 1930s; severe drought and a failure to apply dryland farming methods to prevent wind erosion (the Aeolian processes) caused the phenomenon.

Dust Bowl - Wikipedia the free encyclopedia


One of the problems in trying to decipher actual studies, is that scientist tend to have their own language when relating findings and it tends to cause a bit of confusion - like the infamous emails that spoke of "tricking," remember?

Question for the OP:

Are "sunspots" causing our current warming trend?


the 'Trick'? yes I remember it. do you even know what the 'trick' was? most people dont.

 
Well.........actually, who the hell knows?

The answer is........nobody.......although I must point out that warming stopped 18 years ago now.:2up:

I see, so the polar ice is melting, because....?

How can you honestly state that the warming has stopped 18 years ago? Are you using Joe Arpaio's guide to weather systems?


Ummm...........actually, it doubled in size last year.................


:oops-28::eusa_dance::eusa_dance::eusa_dance::eusa_dance:

I totally get where you can point to the actual size of the arctic ice as a way of attempting to substantiate what you are trying to infer, but that does not validate your claim of the last 18 years.
 
the 'Trick'? yes I remember it. do you even know what the 'trick' was? most people dont.


Yes I do, but I don't think that you have any idea.

Many commentators quoted one email in which Phil Jones said he had used "Mike's Nature trick" in a 1999 graph for the World Meteorological Organization "to hide the decline" in proxy temperatures derived from tree ring analyses when measured temperatures were actually rising. This 'decline' referred to the well-discussed tree ring divergence problem, but these two phrases were taken out of context by climate change sceptics, including US Senator Jim Inhofe and former Governor of Alaska Sarah Palin, as though they referred to some decline in measured global temperatures, even though they were written when temperatures were at a record high.[32] John Tierney, writing in the New York Times in November 2009, said that the claims by sceptics of "hoax" or "fraud" were incorrect, but that the graph on the cover of a report for policy makers and journalists did not show these non-experts where proxy measurements changed to measured temperatures.[33] The final analyses from various subsequent inquiries concluded that in this context 'trick' was normal scientific or mathematical jargon for a neat way of handling data, in this case a statistical method used to bring two or more different kinds of data sets together in a legitimate fashion.[34][35] The EPA notes that in fact, the evidence shows that the research community was fully aware of these issues and that no one was hiding or concealing them...

Climatic Research Unit email controversy - Wikipedia the free encyclopedia
 
Last edited:
Extremely ordinary
December 2, 2014
While the U.S. experienced extreme weather in November, conditions in the Arctic were fairly ordinary. Arctic sea ice in November followed a fairly average growth pace. Ice extent was near average over much of the Arctic with only the Chukchi Sea and Davis Strait showing below average ice conditions.

Overview of conditions

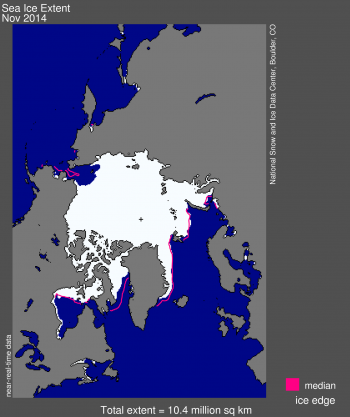
Figure 1. Arctic sea ice extent for November 2014 was 10.36 million square kilometers (4.00 million square miles). The magenta line shows the 1981 to 2010 median extent for that month. The black cross indicates the geographic North Pole. Sea Ice Index data. About the data

Credit: National Snow and Ice Data Center
High-resolution image

Sea ice extent in November averaged 10.36 million square kilometers (4.00 million square miles). This is 630,000 square kilometers (243,000 square miles) below the 1981 to 2010 long-term average of 10.99 million square kilometers (4.24 million square miles) and 520,000 square kilometers (201,000 square miles) above the record low for the month observed in 2006.

Arctic sea ice extent continued to increase throughout the month of November. By the end of the month, most of the Arctic Ocean was covered by ice, the exception being the Chukchi Sea that remained unusually ice free for this time of year. Ice also began to extend into Hudson Bay and Baffin Bay, although ice growth was slower than average in Davis Strait. The near-average ice conditions in the East Greenland, Barents and Kara seas have not been seen in the last few winters, and is the reason that overall extent for November is higher than in recent years.

Conditions in context

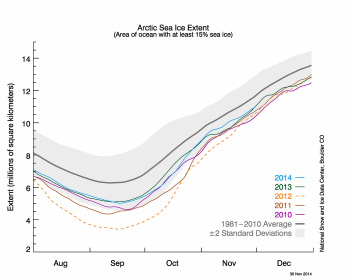
Figure 2. The graph above shows Arctic sea ice extent as of November 30, 2014, along with daily ice extent data for four previous years. 2014 is shown in blue, 2013 in green, 2012 in orange, 2011 in brown, and 2010 in purple. The 1981 to 2010 average is in dark gray. The gray area around the average line shows the two standard deviation range of the data. Sea Ice Index data.

Credit: National Snow and Ice Data Center
High-resolution image

Sea ice extent grew 2.15 million square kilometers (830,000 square miles) during the month of November. This was about average for the month and substantially slower than observed in 2012. While the month started with 1.17 million square kilometers (452,000 square miles) more ice in 2014 than on November 1, 2012, by the end of the month, the difference between 2014 and 2012 had closed to only 416,000 square kilometers (161,000 square miles). The difference in November ice growth between 2012 and 2014 reflects the larger area of open water at the end of summer 2012. With more open water, there was a larger area for new ice to grow.

November 2014 compared to previous years

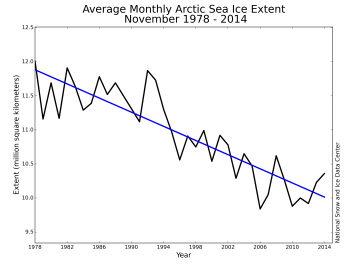
Figure 3. Monthly November ice extent for 1979 to 2014 shows a decline of 4.7% per decade relative to the 1981 to 2010 average.

Credit: National Snow and Ice Data Center
High-resolution image

Arctic sea ice extent for November was the 9th lowest in the satellite record. Through 2014, the linear rate of decline for November extent over the satellite record is 4.7% per decade.

Arctic amplification and mid-latitude weather extremes

Figure 4. This plot of average surface air temperatures from November 17 to 19, 2014 over North America during a polar outbreak shows unusually cold air reaching down into the U.S. Temperatures are in degrees Kelvin. Blues and purples indicate sub-freezing temperatures.

Credit: NSIDC/NOAA ESRL Physical Sciences Divisionr
High-resolution image

Last month we discussed how the extra heat stored in ice-free areas of the ocean during recent summers is released back to the atmosphere as the ice begins to re-form, leading to amplified warming in the Arctic atmosphere. The impact of this warming and its potential impacts on mid-latitude weather patterns and extreme weather events is an active area of research.

This November has been particularly notable for severe weather in the U.S., with a very strong storm in the Bering Sea affecting the Aleutian Islands of western Alaska* (a remnant of Typhoon Nuri that tracked from the tropics through the Aleutians), record-setting low temperatures in the upper plains, and epic lake-effect snow near Buffalo, N.Y. Such individual events cannot be directly linked to climate change, let alone specifically to sea ice loss.

*Correction, December 16, 2014: Adjusted the wording here to make clear that the storm did not affect mainland Alaska, but only the Aleutians.

New research this year from Japanese scientists (Mori et al., 2014) provides support for the hypothesis, put forward by Jennifer Francis of Rutgers University and Steve Vavrus of the University of Wisconsin, that the warming Arctic is contributing to an increasing waviness of the jet stream with the potential for more extreme weather events, including cold outbreaks in the lower 48 U.S. and Eurasia that have been seen in recent years. However, while there is some evidence of this connection, it is not conclusive and many scientists remain skeptical of a link between Arctic sea ice and mid-latitude weather.

Antarctica watch

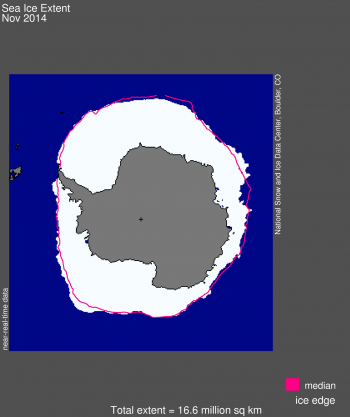
Figure 5. Antarctic sea ice extent for November 2014 was 16.63 million square kilometers (6.42 million square miles). The magenta line shows the 1981 to 2010 median extent for that month. The black cross indicates the geographic South Pole. Sea Ice Index data. About the data

Credit: National Snow and Ice Data Center
High-resolution image

Antarctic sea ice has continued to decline at a faster-than-average pace (approximately 122,000 square kilometers, or 47,100 square miles per day through the month of October, compared to the average rate of 112,000 square kilometers or 43,200 square miles per day), and is now about 650,000 square kilometers (251,000 square miles) below the level for the date recorded in 2013. Currently ice extent remains about 700,000 square kilometers (270,000 square miles) higher than the 1981 to 2010 average for this time of year. Large reductions in the Bellingshausen Sea and the southern Indian Ocean were the main causes of the Antarctic-wide decrease, driven in large part by persistent northerly winds. Air temperatures over the Southern Ocean for the month were near average in nearly all areas. On the icy continent itself, cool conditions prevailed over the Antarctic Peninsula and West Antarctica (1 to 2 degrees Celsius, or 1.8 to 3.6 degrees Fahrenheit below average) while warm conditions were the rule in the Eastern Hemisphere section (2 to 4 degrees Celsius, or 3.6 to 7.2 degrees Fahrenheit above average).

Arctic Sea Ice News and Analysis Sea ice data updated daily with one-day lag
 
Mike's (M Mann) Nature (the science journal) trick involved truncating proxies, replacing the removed portions with instrumental temperature data, and worst of all, padding the series to be spliced together so that there would be no jump at the cut. not scientific and meant to misdirect.
 
the 'Trick'? yes I remember it. do you even know what the 'trick' was? most people dont.


Yes I do, but I don't think that you have any idea.

Many commentators quoted one email in which Phil Jones said he had used "Mike's Nature trick" in a 1999 graph for the World Meteorological Organization "to hide the decline" in proxy temperatures derived from tree ring analyses when measured temperatures were actually rising. This 'decline' referred to the well-discussed tree ring divergence problem, but these two phrases were taken out of context by climate change sceptics, including US Senator Jim Inhofe and former Governor of Alaska Sarah Palin, as though they referred to some decline in measured global temperatures, even though they were written when temperatures were at a record high.[32] John Tierney, writing in the New York Times in November 2009, said that the claims by sceptics of "hoax" or "fraud" were incorrect, but that the graph on the cover of a report for policy makers and journalists did not show these non-experts where proxy measurements changed to measured temperatures.[33] The final analyses from various subsequent inquiries concluded that in this context 'trick' was normal scientific or mathematical jargon for a neat way of handling data, in this case a statistical method used to bring two or more different kinds of data sets together in a legitimate fashion.[34][35] The EPA notes that in fact, the evidence shows that the research community was fully aware of these issues and that no one was hiding or concealing them...

Climatic Research Unit email controversy - Wikipedia the free encyclopedia


quoting a wikipedia article instead of just answering? lame
 
Mike's (M Mann) Nature (the science journal) trick involved truncating proxies, replacing the removed portions with instrumental temperature data, and worst of all, padding the series to be spliced together so that there would be no jump at the cut. not scientific and meant to misdirect.

This was investigated and found to NOT be the case.

Eight committees investigated the allegations and published reports, finding no evidence of fraud or scientific misconduct.[15] The scientific consensus that global warming is occurring as a result of human activity remained unchanged by the end of the investigations.[17] However, the reports urged the scientists to avoid any such allegations in the future, and to regain public confidence following this media storm, with "more efforts than ever to make available all their supporting data - right down to the computer codes they use - to allow their findings to be properly verified". Climate scientists and organisations pledged to improve scientific research and collaboration with other researchers by improving data management and opening up access to data, and to honour any freedom of information requests that relate to climate science.

Climatic Research Unit email controversy - Wikipedia the free encyclopedia
 
the 'Trick'? yes I remember it. do you even know what the 'trick' was? most people dont.


Yes I do, but I don't think that you have any idea.

Many commentators quoted one email in which Phil Jones said he had used "Mike's Nature trick" in a 1999 graph for the World Meteorological Organization "to hide the decline" in proxy temperatures derived from tree ring analyses when measured temperatures were actually rising. This 'decline' referred to the well-discussed tree ring divergence problem, but these two phrases were taken out of context by climate change sceptics, including US Senator Jim Inhofe and former Governor of Alaska Sarah Palin, as though they referred to some decline in measured global temperatures, even though they were written when temperatures were at a record high.[32] John Tierney, writing in the New York Times in November 2009, said that the claims by sceptics of "hoax" or "fraud" were incorrect, but that the graph on the cover of a report for policy makers and journalists did not show these non-experts where proxy measurements changed to measured temperatures.[33] The final analyses from various subsequent inquiries concluded that in this context 'trick' was normal scientific or mathematical jargon for a neat way of handling data, in this case a statistical method used to bring two or more different kinds of data sets together in a legitimate fashion.[34][35] The EPA notes that in fact, the evidence shows that the research community was fully aware of these issues and that no one was hiding or concealing them...

Climatic Research Unit email controversy - Wikipedia the free encyclopedia


quoting a wikipedia article instead of just answering? lame


Oh, you disagree with findings? Please enlighten us....
 
the 'Trick'? yes I remember it. do you even know what the 'trick' was? most people dont.


Yes I do, but I don't think that you have any idea.

Many commentators quoted one email in which Phil Jones said he had used "Mike's Nature trick" in a 1999 graph for the World Meteorological Organization "to hide the decline" in proxy temperatures derived from tree ring analyses when measured temperatures were actually rising. This 'decline' referred to the well-discussed tree ring divergence problem, but these two phrases were taken out of context by climate change sceptics, including US Senator Jim Inhofe and former Governor of Alaska Sarah Palin, as though they referred to some decline in measured global temperatures, even though they were written when temperatures were at a record high.[32] John Tierney, writing in the New York Times in November 2009, said that the claims by sceptics of "hoax" or "fraud" were incorrect, but that the graph on the cover of a report for policy makers and journalists did not show these non-experts where proxy measurements changed to measured temperatures.[33] The final analyses from various subsequent inquiries concluded that in this context 'trick' was normal scientific or mathematical jargon for a neat way of handling data, in this case a statistical method used to bring two or more different kinds of data sets together in a legitimate fashion.[34][35] The EPA notes that in fact, the evidence shows that the research community was fully aware of these issues and that no one was hiding or concealing them...

Climatic Research Unit email controversy - Wikipedia the free encyclopedia


show me where the WMO or MBH98 graph acknowledged that the 'trick' had been performed. in any other field Mann could have gone to jail for fraud.
 

Forum List

Back
Top