task0778
Diamond Member
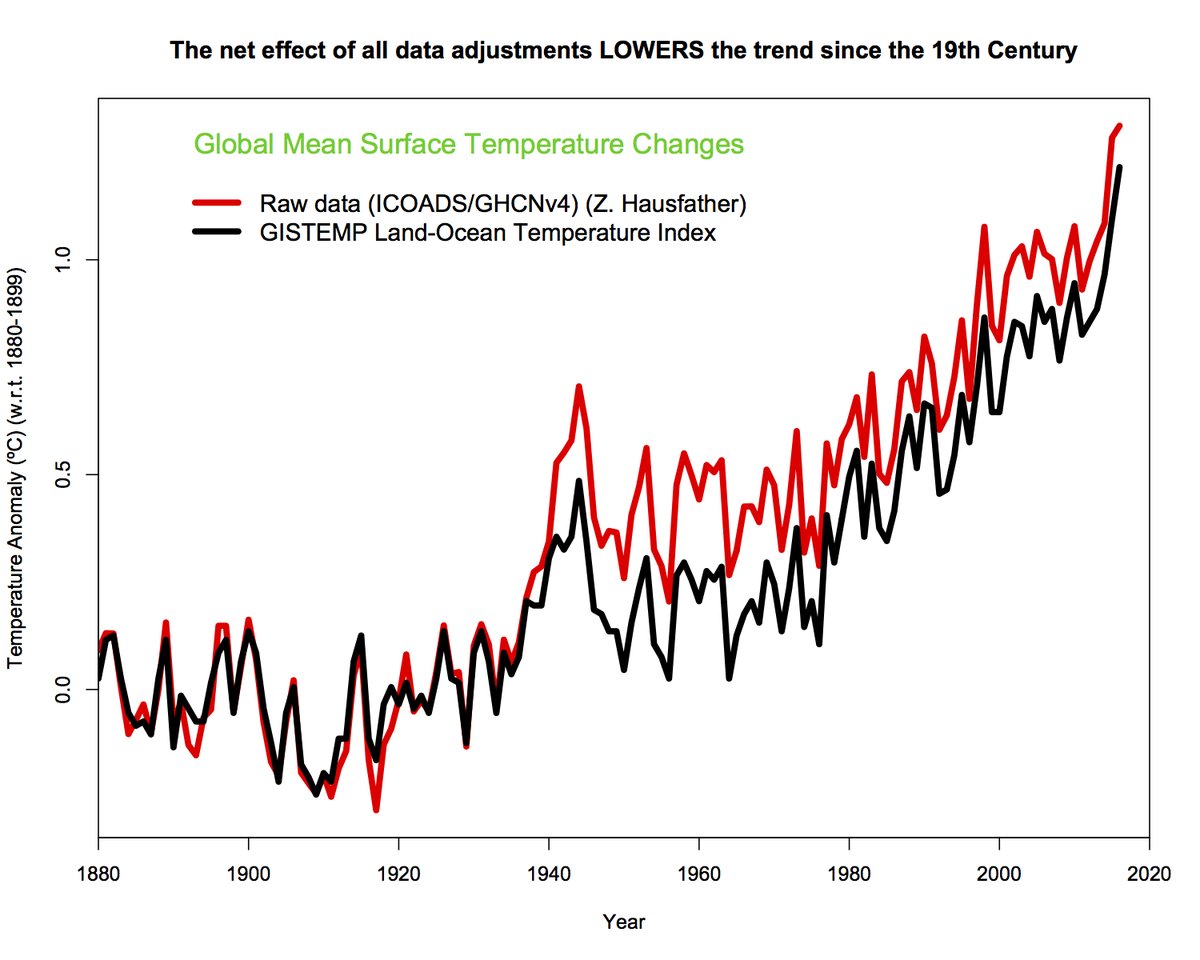
For the past 150 years or so global temperature readings have been recorded at various stations and sites around the world. Obviously the situation for these sites and stations change as urban sprawl occurs or sea levels change where those temps are recorded. So, 'adjustments' have to be made, otherwise the data becomes inaccurate. NOW - one might think that such adjustments might raise the temp values in some places but lower them in others. But here comes the problem: as each adjustment is made, the newer version of temp data is almost always showing a steeper warming linear trend upward. So, how can this be? Answer: the data was fudged. Consider this from a new study, done by respected and credentialed scientists and experts:
Using the government's own data. the researchers showed that government agencies were able to "prove" that the Earth is warming simply by leaving out vital information.
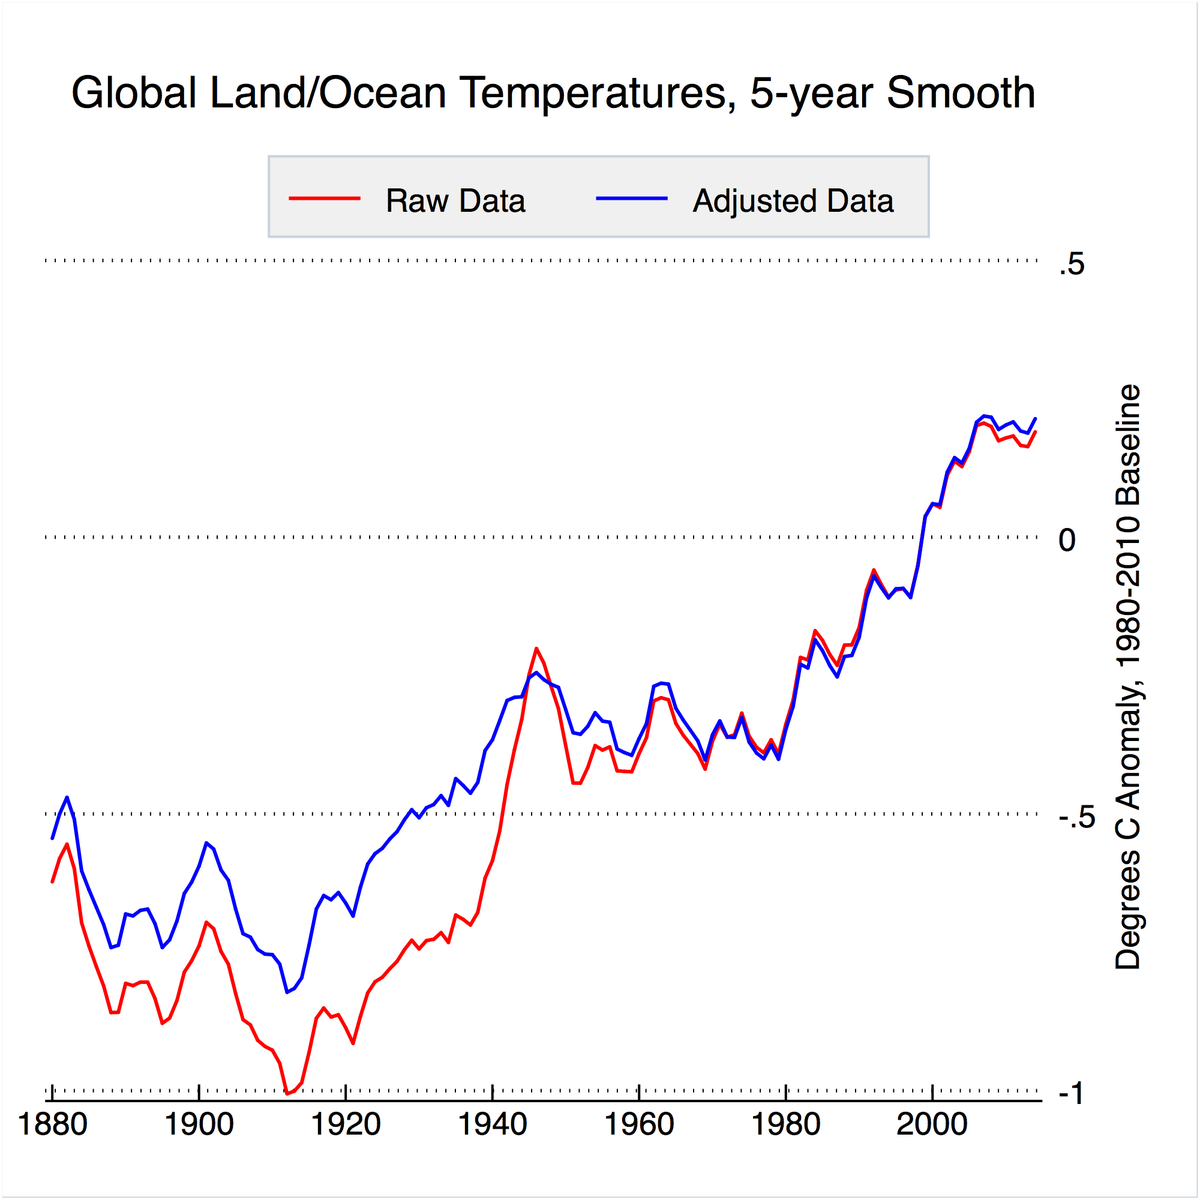
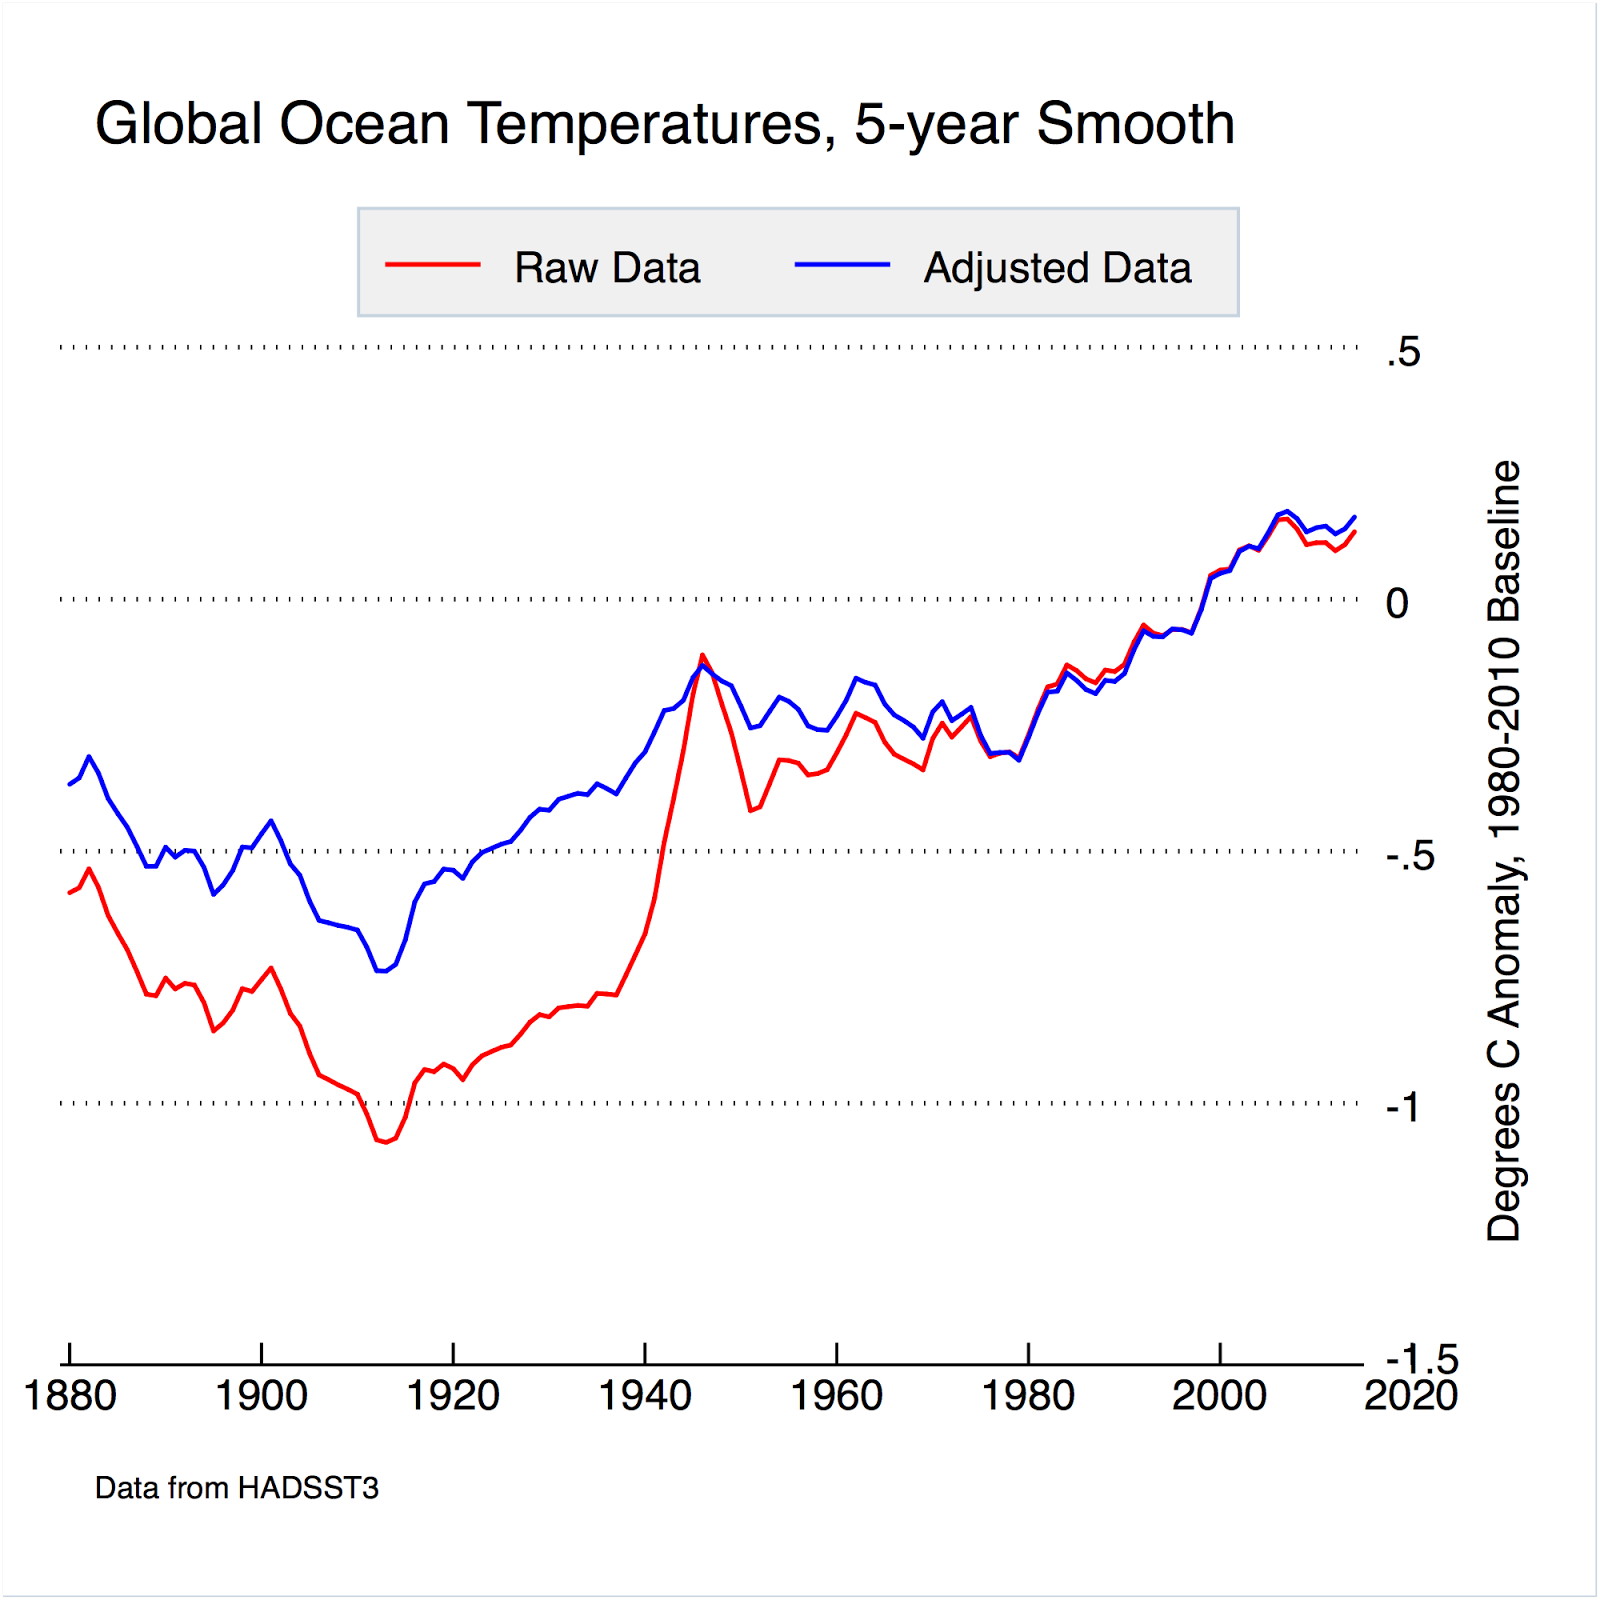
While the notion that some "adjustments" to historical data might need to be made is not challenged, logically it would be expected that such historical temperature data adjustments would sometimes raise these temperatures, and sometimes lower them. This situation would mean that the impact of such adjustments on the temperature trend line slope is uncertain. However, each new version of GAST has nearly always exhibited a steeper warming linear trend over its entire history.
The scientists are not arguing that adjustments to temperature data are not necessary. Over the 160 years or so of recorded temps, the weather stations where the data is gathered sometimes move, or a city grows up around them, or there is a change in sea levels where the temps are recorded. All of these factors and more would make the data useless without "adjustments."
The professors argue – and skeptics have been saying this for years – that it is just too convenient for these "adjustments" to almost always show an increase in temperature over the unadjusted data. This is statistically impossible and leads to the inescapable conclusion that the books are being cooked.
https://thsresearch.files.wordpress.com/2017/05/ef-gast-data-research-report-062717.pdf
Using the government's own data. the researchers showed that government agencies were able to "prove" that the Earth is warming simply by leaving out vital information.
While the notion that some "adjustments" to historical data might need to be made is not challenged, logically it would be expected that such historical temperature data adjustments would sometimes raise these temperatures, and sometimes lower them. This situation would mean that the impact of such adjustments on the temperature trend line slope is uncertain. However, each new version of GAST has nearly always exhibited a steeper warming linear trend over its entire history.
The scientists are not arguing that adjustments to temperature data are not necessary. Over the 160 years or so of recorded temps, the weather stations where the data is gathered sometimes move, or a city grows up around them, or there is a change in sea levels where the temps are recorded. All of these factors and more would make the data useless without "adjustments."
The professors argue – and skeptics have been saying this for years – that it is just too convenient for these "adjustments" to almost always show an increase in temperature over the unadjusted data. This is statistically impossible and leads to the inescapable conclusion that the books are being cooked.
https://thsresearch.files.wordpress.com/2017/05/ef-gast-data-research-report-062717.pdf
Last edited: