
- Thread starter
- #41
Your "indisputable fact" is thoroughly disputed by the facts, so any conclusion you draw is equally flawed.
What is madness? To have erroneous perceptions and to reason correctly from them.
- Voltaire

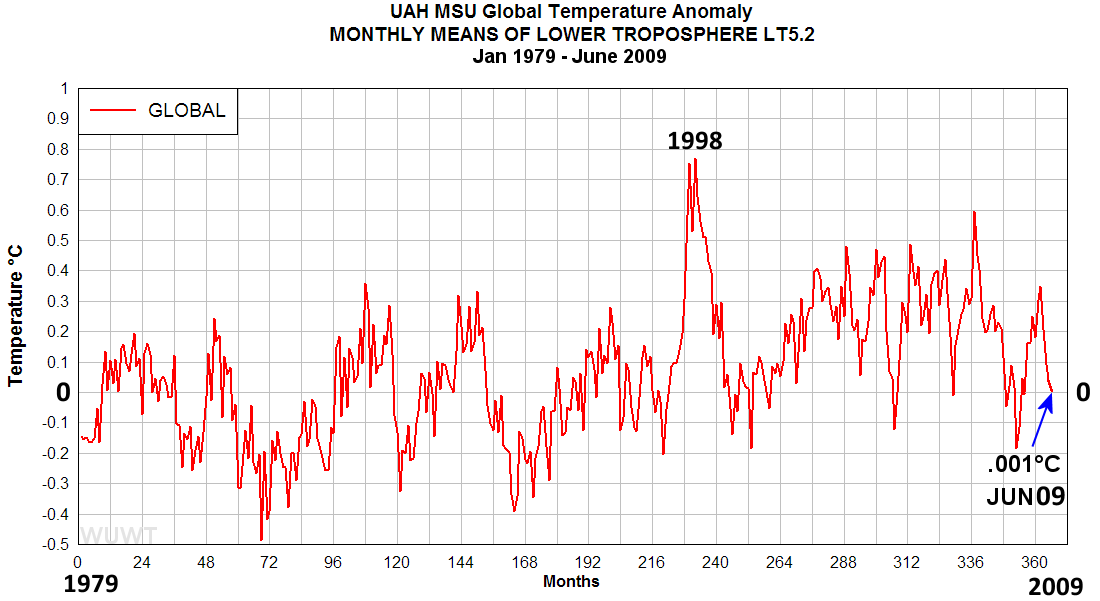
The data we have since we had highly accurate temp readings from satellites says that the average temperature is the same today as it was over 30 years ago.
If you dont want to see that I cant help it man.
I have no pony in this show, i'm just relaying the information.
Have a nice being a jerk to people for no good reason
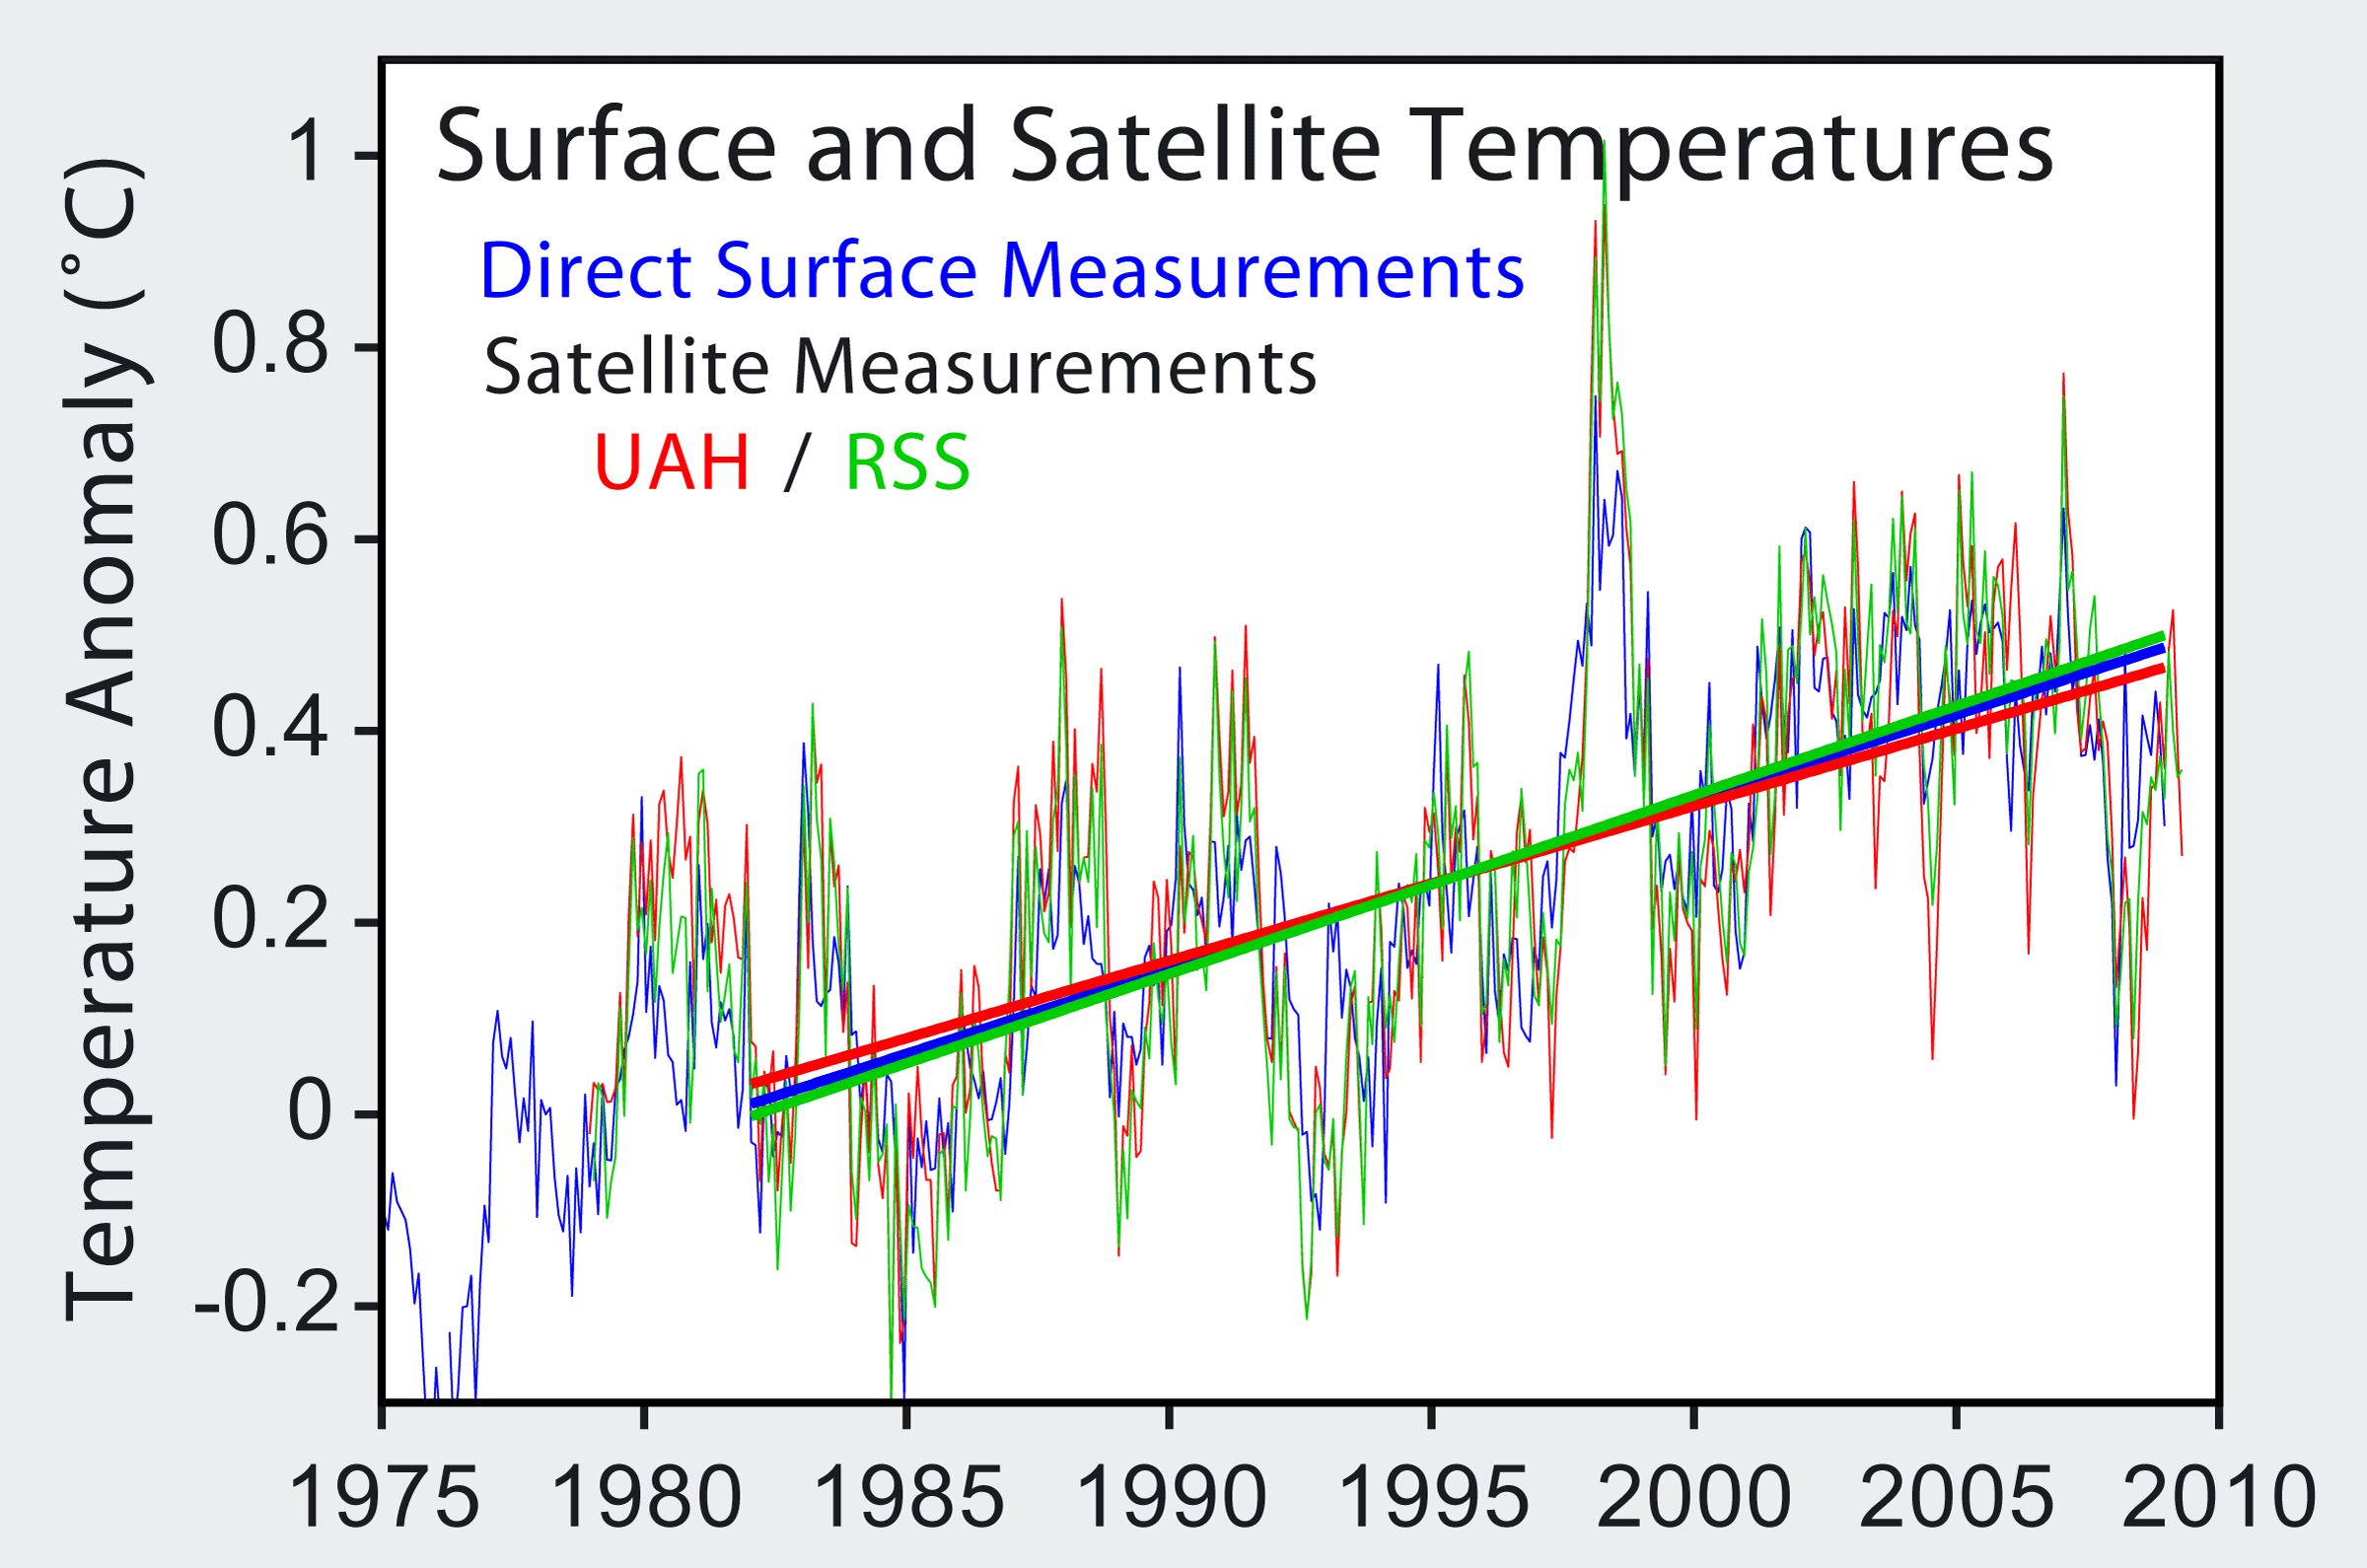
Well, since surface temps didn't support your claim that the average temp is the same today as 20 years ago, in typical CON$ervative fashion rather than admit that GOP hate radio deliberately misinformed you, you call ME a jerk for being better informed.
Here's the 30 year satellite data, tell me you see no warming trend either.

Incomplete...

No warming...


")
