New Report Confirms Global Cool Down

Sinatra

Senior Member
Feb 5, 2009
8,013
1,008
48
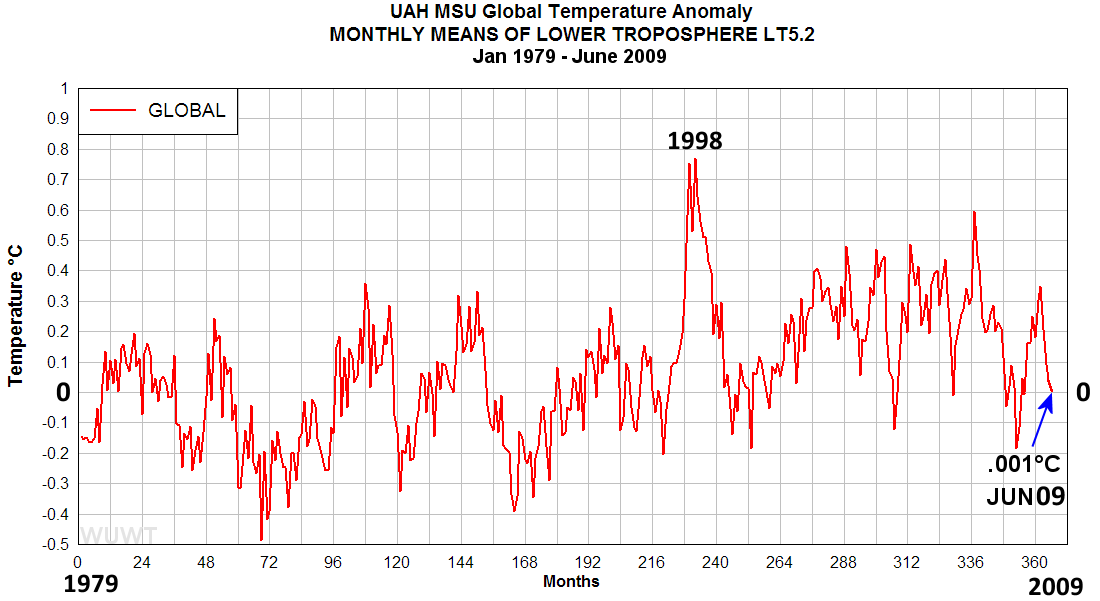
UAH-MSU, among the most accurate global temperature data set resources, shows another month of global cooling for June 2009.

When going back to 1979, when the far more accurate satellite data becomes available, we see only a very slight warming from then to now - and remember, 1979 represents a year when the earth was coming out of the oft-reported impending Ice Age that took hold in the junk-science media of that decade.

Now if you recall, 1998 was the poster child of the global warmers - an anomaly year that saw dramatic cooling to follow, with more subtle cooling in the proceeding years.


In essence, there has been no global warming in the last 30 years.

uah_jun09.png
 
One penguin does not an ice age make :p

While I agree with you that global warming is garbage science, I think we can't fall into the trap of reading too much into too small a data set. That is what the bad guys do.


I do recall that the mid late 70s were unusually cold. The winter of 77 got all kinds of press because, as you mention, folks were afraid pollution was freezing the planet, rather than heating it up.
 
Chris ... a bit of logic for you before you decide to once again post that graph ...

... you rant and rave that average is more important, yet you are only focusing on two years with that graph and comparing it to an average of 21 years ... that's both hypocritical and dishonest in so many ways, so stop being so amazed at our laughing at you every time you use it.
 
The sun is at its lowest level of activity in 80 years and yet the ice continues to melt.

Why?
 
Yup....Looks like the extent of Arctic sea ice is trending upwards, too.

Thanks for re-re-re-re-re-re-re-reposting that chart, Christine.

You are welcome.

We are still way below the 20 year average even though the sun is at its lowest level of activity in 80 years.

Why?
 
The sun is at its lowest level of activity in 80 years and yet the ice continues to melt.

Why?

Meh ... lots of reasons, which you ignored of course ... and of course it's melting this time of year, it's called summer in the north ... which just happens to be where most of the ice is ... :eusa_whistle:

You do notice that your graph is only for the northern hemisphere, right?
 
According to your stupid chart, that trend has been reversing.

You really oughtta get some new material.

Of course the trend goes up and down from year to year.

But the overall trend is downward over the last 40 years.

Nice try, though.
 
The sun is at its lowest level of activity in 80 years and yet the ice continues to melt.

Why?

Meh ... lots of reasons, which you ignored of course ... and of course it's melting this time of year, it's called summer in the north ... which just happens to be where most of the ice is ... :eusa_whistle:

You do notice that your graph is only for the northern hemisphere, right?


The arctic ice is melting and so are the glaciers.

That fact that you would try to deny this shows how far gone you are.
 
According to your stupid chart, that trend has been reversing.

You really oughtta get some new material.

Of course the trend goes up and down from year to year.

But the overall trend is downward over the last 40 years.

Nice try, though.
40 years over the entirety of planetary history...Which, incidentally, didn't begin with the invention of the internal combustion engine.

Not a nice try, though.

Keep swinging away as the ice melts.....
 
Argumentum ad nauseam (argument to the point of disgust; i.e., by repitition). This is the fallacy of trying to prove something by saying it again and again. But no matter how many times you repeat something, it will not become any more or less true than it was in the first place. Of course, it is not a fallacy to state the truth again and again; what is fallacious is to expect the repitition alone to substitute for real arguments.
 
On the ice melt issue......

I was told when I was in school that there was enough water stored in that ice to raise the sea level by 30' if it were to melt. I have not heard of sea levels rising. Were scientists wrong back then, or is the water going someplace, or what?
 
Months ago I relayed that I had heard a talk show with NASA nerds stating the real threat to the earth wasn't global warming, but global cool-down...which happens coincidentally with sunspots for some unknown reason. And sunspots are increasing in incidence or increasing in duration or some such shit. They were VERY worried about that.

They concurred that global warming is a jar of crap.
 
Argumentum ad nauseam (argument to the point of disgust; i.e., by repitition). This is the fallacy of trying to prove something by saying it again and again. But no matter how many times you repeat something, it will not become any more or less true than it was in the first place. Of course, it is not a fallacy to state the truth again and again; what is fallacious is to expect the repitition alone to substitute for real arguments.
I am good at that.

Repeat after me, we can achieve world socialism, the world is getting hotter and the sky is falling, and the moon is made of blue cheese, and it is our obligation to send spacecraft there to mine it.
 
UAH-MSU, among the most accurate global temperature data set resources

You couldn't be a CON$ervative if you weren't calling the least accurate data the most accurate. :rofl:
Ditto-Dopers Christy and Spencer are by far and away the least accurate sources of data, deliberately using the wrong sign to correct for satellite drift. :cuckoo:

Climate myths: The lower atmosphere is cooling, not warming - environment - 16 May 2007 - New Scientist

In 1992, however, an analysis of satellite data by John Christy at the University of Alabama in Huntsville, US, concluded that the lower part of the troposphere - the first 10 kilometres of atmosphere - had cooled relative to the surface since 1979, when the first satellites capable monitoring temperature measurements were launched. This trend seemed to continue into the late 1990s and also seemed to be supported by balloon measurements.

This was not quite the "nail in the coffin" for global warming that some sceptics claimed. If the satellite data was correct, it meant there was something wrong with the existing models of climate change. But it made little sense for the lower atmosphere to be cooling even as the surface warmed, suggesting the problem lay with the data. The jury was out until the issue could be resolved one way or another.

Slowing satellites

The answer came in a series of studies published in 2005 (see Sceptics forced into climate climbdown).

One study in Science revealed errors in the way satellite data had been collected and interpreted. For instance, the orbit of satellites gradually slows, which has to be taken into account because it affects the time of day at which temperature recording are taken. This problem was always recognised, but the corrections were given the wrong sign (negative instead positive and vice versa).

A second study, also in Science, looked at the weather balloon data. Measurements of the air temperature during the day can be skewed if the instruments are heated by sunlight. Over the years the makers of weather balloons had come up with better methods of preventing or correcting for this effect, but because no one had taken these improvements into account, the more accurate measurements appeared to show daytime temperatures getting cooler.

The corrected temperature records show that tropospheric temperatures are indeed rising at roughly the same rate as surface temperatures. Or, as a 2006 report by the US Climate Change Science Program (pdf) puts it: "For recent decades, all current atmospheric data sets now show global-average warming that is similar to the surface warming."
 
Uh-huh....I guess that's why the EPA stuffed their latest report that the temps had been trending downward for the last decade down the Memory Hole. :rolleyes:

The last decade was the WARMEST in the history of direct instrument measurement!! :cuckoo:
 

Forum List

Back
Top