NASA: Unprecedented melting of Greenland's ice sheet

Greenhouse warming is up


The ONLY "warming" in the raw data is from the surface of growing urban areas.... this, the deliberate misinterpretation of the URban Heat Sink Effect on the SURFACE Ground Temp series...


NASA Visible Earth: In the City, Bright is the New Black

urban areas regularly record air temperatures as much as 6° Celsius (10° Fahrenheit) hotter than the surrounding suburban and rural areas.


In other words, as we go from nature to Tokyo, we warm 10 full degrees.

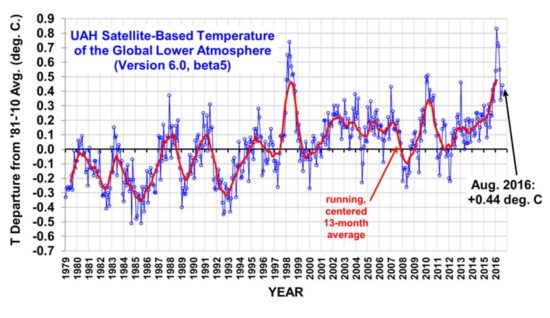
The atmosphere is not warming
The oceans are not warming
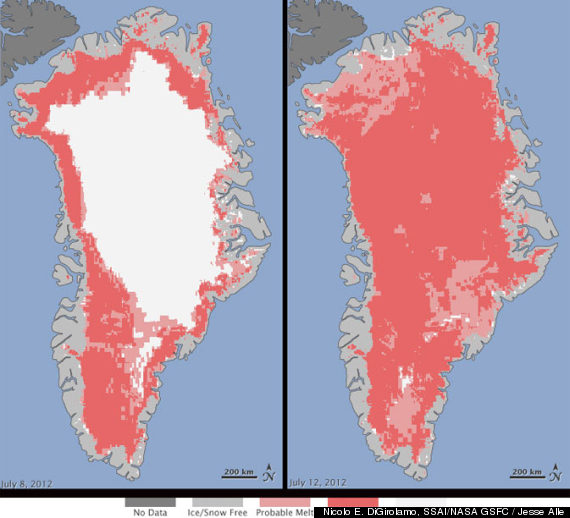
90% of Earth ice on Antarctica is growing

.....


ZZZZZZZZZZZZZZzzzzzzzzzzzzzzzzzzz
 
Do you have any data that supports your first sentence? If so, we'd like to see it. Your link does not. Nothing you have EVER posted here supports that claim.

ZZZZZZZzzzzzzzzzZZZZZZZZZzzzzzzzZZZZZZZZZzzzzzzzzz......
 
I have posted link after link after link here. I'm through posting the same links over and over. You've seen 'em, so stop lying about it.
 
I have not seen link after link and the very few links you do post have NOT supported your arguments, even by intimation or implication. Several have flat out disagreed with the contention for which you posted them. Your links are universally to blogs or the like, not to peer reviewed studies. They're crap.
 
I have not seen link after link and the very few links you do post have NOT supported your arguments, even by intimation or implication. Several have flat out disagreed with the contention for which you posted them. Your links are universally to blogs or the like, not to peer reviewed studies. They're crap.
peer review is wayyyyyyyyyy overrated. In fact, it's garbage. That was easy. You can do it, and I can do it.
 
The whole "peer review" process of the Tippy Toppiest "top climate scientists" got outed in Climategate for what it obviously was, a sham to promote the idea of "warming" whether the data supported a conclusion of "warming" or not - the "studies" claiming Antarctic melt are Exhibit A of FRAUD replacing science here.
 
Several have flat out disagreed with the contention for which you posted them


In other words, I have posted here links to the FUDGING of the atmospheric satellite and balloon data 50 times, and each time the ARTICLE I source is pro-FRAUD, never questions the NEED to "correct" two highly correlated data series measuring the same thing. So hence to notice those two series were FUDGED with UNCORRELATED "corrections" is somehow "wrong" since the article still pushes the FRAUD while never questioning the need for the "correction."

In a nutshell, Antarctic ice growth and no warming in the atmosphere are two TRUTHS the "warmers" cannot exist with, so they FUDGE and they LIE and the taxpayer pays parroting morons like crick to shout down...


The ACTUAL DATA had no need for "correction." The highly correlated satellite and balloon data showed NO WARMING in the atmosphere because the atmosphere IS NOT WARMING despite rising CO2.
 
The two satellite datasets do in fact show warming. Just not as much as surface datasets, which in turn show less warming than climate model predictions.

Balloon datasets are problematic and have been revised dramatically in recent years.
 
The two satellite datasets do in fact show warming


If you cherry pick a "down" year and an "up" year as your endpoints of a flat line and bobs up and down a bit.

In 1997, the "warmest year on record," both the satellites and the balloons showed a cooler than normal atmosphere...
 
The satellites started in 1979 and continue to today. No cherrypicking. It is what it is, although RSS has made some odd choices lately.

The balloon data is not suitable to make more than vague generalizations for temperature. A pity, it would be nice to extend back to the 50's.
 
The two satellite datasets do in fact show warming


If you cherry pick a "down" year and an "up" year as your endpoints of a flat line and bobs up and down a bit.

In 1997, the "warmest year on record," both the satellites and the balloons showed a cooler than normal atmosphere...
Really?

UAH Global Temperature Update for August, 2016: +0.44 deg. C « Roy Spencer, PhD


The Version 6.0 global average lower tropospheric temperature (LT) anomaly for August 2016 is +0.44 deg. C, up a little from the July, 2016 value +0.39 deg. C (click for full size version):

UAH_LT_1979_thru_August_2016_v6-550x318.jpg


Well now, that looks like we have seen considerable warming since 1979. In fact, looking at the graph, your 'pause' average is higher than most of the points on the graph prior to 1997. And that is taken from satellite measurements.

Which part of that looks like an exit from natural variability to you rocks?
 
Unprecedented melting of Greenland's ice sheet this month has stunned NASA scientists and has highlighted broader concerns that the region is losing a remarkable amount of ice overall.

According to a NASA press release, about half of Greenland's surface ice sheet naturally melts during an average summer. But the data from three independent satellites this July, analyzed by NASA and university scientists, showed that in less than a week, the amount of thawed ice sheet surface skyrocketed from 40 percent to 97 percent.

In over 30 years of observations, satellites have never measured this amount of melting, which reaches nearly all of Greenland's surface ice cover.

When Son Nghiem of NASA's Jet Propulsion Laboratory observed the recent melting phenomenon, he said in the NASA press release, "This was so extraordinary that at first I questioned the result: Was this real or was it due to a data error?"

Scientists at NASA's Goddard Space Flight Center, University of Georgia-Athens and City University of New York all confirmed the remarkable ice melt.

NASA's cryosphere program manager, Tom Wagner, credited the power of satellites for observing the melt and explained to The Huffington Post that, although this specific event may be part of a natural variation, "We have abundant evidence that Greenland is losing ice, probably because of global warming, and it's significantly contributing to sea level rise."

Wagner said that ice is clearly thinning around the periphery, changing Greenland's overall ice mass, and he believes this is primarily due to warming ocean waters "eating away at the ice." He cautiously added, "It seems likely that's correlated with anthropogenic warming."

This specific extreme melt occurred in large part due to an unusual weather pattern over Greenland this year, what the NASA press release describes as a series of "heat domes," or an "unusually strong ridge of warm air."
Notable melting occurred in specific regions of Greenland, such as the area around Summit Station, located two miles above sea level. Not since 1889 has this kind of melting occurred, according to ice core analysis described in NASA's press release.

Goddard glaciologist Lora Koenig said that similar melting events occur about every 150 years, and this event is consistent with that schedule, citing the previous 1889 melt. But, she added, "if we continue to observe melting events like this in upcoming years, it will be worrisome."
"One of the big questions is 'What's happening in the Arctic in general?'" Wagner said to HuffPost.

Just last week, another unusual event occurred in the region: the calving of an iceberg twice the size of Manhattan from Greenland's Petermann Glacier.

Over the past few months, separate studies have emerged that suggest humans are playing a "dominant role" in ocean warming, and that specific regions of the world, such as the U.S. East Coast, are increasingly vulnerable to sea level rise.

Wagner explained that in recent years, studies have observed thinning sea ice and "dramatic" overall changes. He was clear, "We don’t want to lose sight of the fact that Greenland is losing a tremendous amount of ice overall."

o-NASA-GREENLAND-MELT-570.jpg

NASA CAPTION: Extent of surface melt over Greenland’s ice sheet on July 8 (left) and July 12 (right). Measurements from three satellites showed that on July 8, about 40 percent of the ice sheet had undergone thawing at or near the surface. In just a few days, the melting had dramatically accelerated and an estimated 97 percent of the ice sheet surface had thawed by July 12. In the image, the areas classified as “probable melt” (light pink) correspond to those sites where at least one satellite detected surface melting. The areas classified as “melt” (dark pink) correspond to sites where two or three satellites detected surface melting. The satellites are measuring different physical properties at different scales and are passing over Greenland at different times. As a whole, they provide a picture of an extreme melt event about which scientists are very confident. Credit: Nicolo E. DiGirolamo, SSAI/NASA GSFC, and Jesse Allen, NASA Earth Observatory
We'll file that with NASA's claim they discovered life on Mars.
 
Unprecedented melting of Greenland's ice sheet this month has stunned NASA scientists and has highlighted broader concerns that the region is losing a remarkable amount of ice overall.

According to a NASA press release, about half of Greenland's surface ice sheet naturally melts during an average summer. But the data from three independent satellites this July, analyzed by NASA and university scientists, showed that in less than a week, the amount of thawed ice sheet surface skyrocketed from 40 percent to 97 percent.

In over 30 years of observations, satellites have never measured this amount of melting, which reaches nearly all of Greenland's surface ice cover.

When Son Nghiem of NASA's Jet Propulsion Laboratory observed the recent melting phenomenon, he said in the NASA press release, "This was so extraordinary that at first I questioned the result: Was this real or was it due to a data error?"

Scientists at NASA's Goddard Space Flight Center, University of Georgia-Athens and City University of New York all confirmed the remarkable ice melt.

NASA's cryosphere program manager, Tom Wagner, credited the power of satellites for observing the melt and explained to The Huffington Post that, although this specific event may be part of a natural variation, "We have abundant evidence that Greenland is losing ice, probably because of global warming, and it's significantly contributing to sea level rise."

Wagner said that ice is clearly thinning around the periphery, changing Greenland's overall ice mass, and he believes this is primarily due to warming ocean waters "eating away at the ice." He cautiously added, "It seems likely that's correlated with anthropogenic warming."

This specific extreme melt occurred in large part due to an unusual weather pattern over Greenland this year, what the NASA press release describes as a series of "heat domes," or an "unusually strong ridge of warm air."
Notable melting occurred in specific regions of Greenland, such as the area around Summit Station, located two miles above sea level. Not since 1889 has this kind of melting occurred, according to ice core analysis described in NASA's press release.

Goddard glaciologist Lora Koenig said that similar melting events occur about every 150 years, and this event is consistent with that schedule, citing the previous 1889 melt. But, she added, "if we continue to observe melting events like this in upcoming years, it will be worrisome."
"One of the big questions is 'What's happening in the Arctic in general?'" Wagner said to HuffPost.

Just last week, another unusual event occurred in the region: the calving of an iceberg twice the size of Manhattan from Greenland's Petermann Glacier.

Over the past few months, separate studies have emerged that suggest humans are playing a "dominant role" in ocean warming, and that specific regions of the world, such as the U.S. East Coast, are increasingly vulnerable to sea level rise.

Wagner explained that in recent years, studies have observed thinning sea ice and "dramatic" overall changes. He was clear, "We don’t want to lose sight of the fact that Greenland is losing a tremendous amount of ice overall."

o-NASA-GREENLAND-MELT-570.jpg

NASA CAPTION: Extent of surface melt over Greenland’s ice sheet on July 8 (left) and July 12 (right). Measurements from three satellites showed that on July 8, about 40 percent of the ice sheet had undergone thawing at or near the surface. In just a few days, the melting had dramatically accelerated and an estimated 97 percent of the ice sheet surface had thawed by July 12. In the image, the areas classified as “probable melt” (light pink) correspond to those sites where at least one satellite detected surface melting. The areas classified as “melt” (dark pink) correspond to sites where two or three satellites detected surface melting. The satellites are measuring different physical properties at different scales and are passing over Greenland at different times. As a whole, they provide a picture of an extreme melt event about which scientists are very confident. Credit: Nicolo E. DiGirolamo, SSAI/NASA GSFC, and Jesse Allen, NASA Earth Observatory
The story is from 2012. Greenland should be ice free now.
image.jpeg
 
If you'd read the original, 2012 article, you would not have come to that conclusion.
 
Scientists Map Movement of Greenland Ice During Past 9,000 Years

" However, the vast interior of Greenland is slowly thickening"


In other words, the warmers can cherry pick, and likely are dumping rock salt in certain areas, but they cannot stop the ice age from manufacturing a new ice core layer, and it does that EVERY year, and will continue to do so. The "melting" at the edges is a combo of the southern tip experiencing summer and 100% pure fudge north of the southern tip.
 
"Likely are dumping rock salt in certain areas". Wow.... Where are we getting the salt? Bet you can't answer that one, eh Mr Big Brain? Where? Huh?

"Cannot stop the ice age from manufacturing a new ice core layer" Incredible...Is this in some sort of Ice Queen factory or are these cores just laying around propped up against pine trees and boulders?

"100% pure fudge north of the southern tip". You mean, north of the Arctic circle? Are you suggesting that it's impossible for ice above the Arctic circle to ever melt? Your "continental ice age" hypothesis suggests precisely that. Is that what you mean to say? Yes or no?
 
The two satellite datasets do in fact show warming


If you cherry pick a "down" year and an "up" year as your endpoints of a flat line and bobs up and down a bit.

In 1997, the "warmest year on record," both the satellites and the balloons showed a cooler than normal atmosphere...
Really?

UAH Global Temperature Update for August, 2016: +0.44 deg. C « Roy Spencer, PhD


The Version 6.0 global average lower tropospheric temperature (LT) anomaly for August 2016 is +0.44 deg. C, up a little from the July, 2016 value +0.39 deg. C (click for full size version):

UAH_LT_1979_thru_August_2016_v6-550x318.jpg


Well now, that looks like we have seen considerable warming since 1979. In fact, looking at the graph, your 'pause' average is higher than most of the points on the graph prior to 1997. And that is taken from satellite measurements.


Chart shows flat temps for 2 decades
 
No it doesn't. It shows an enormous peak from the 1998 el Nino and then continues upward at its previous rate, accelerating in the last several years. As was pointed out in the earlier text, almost every point in the last two decades is higher than the prio data.
 

Forum List

Back
Top