NASA: Earth Tops Hottest 12 Months On Record Again, Thanks To Warm February

NASA: Earth Tops Hottest 12 Months On Record Again, Thanks To Warm February
by Joe Romm Posted on March 15, 2015 at 11:18 am

"NASA: Earth Tops Hottest 12 Months On Record Again, Thanks To Warm February"

There had never been as hot a 12-month period in NASA’s database as February 2014–January 2015. But that turned out to be a very short-lived record.

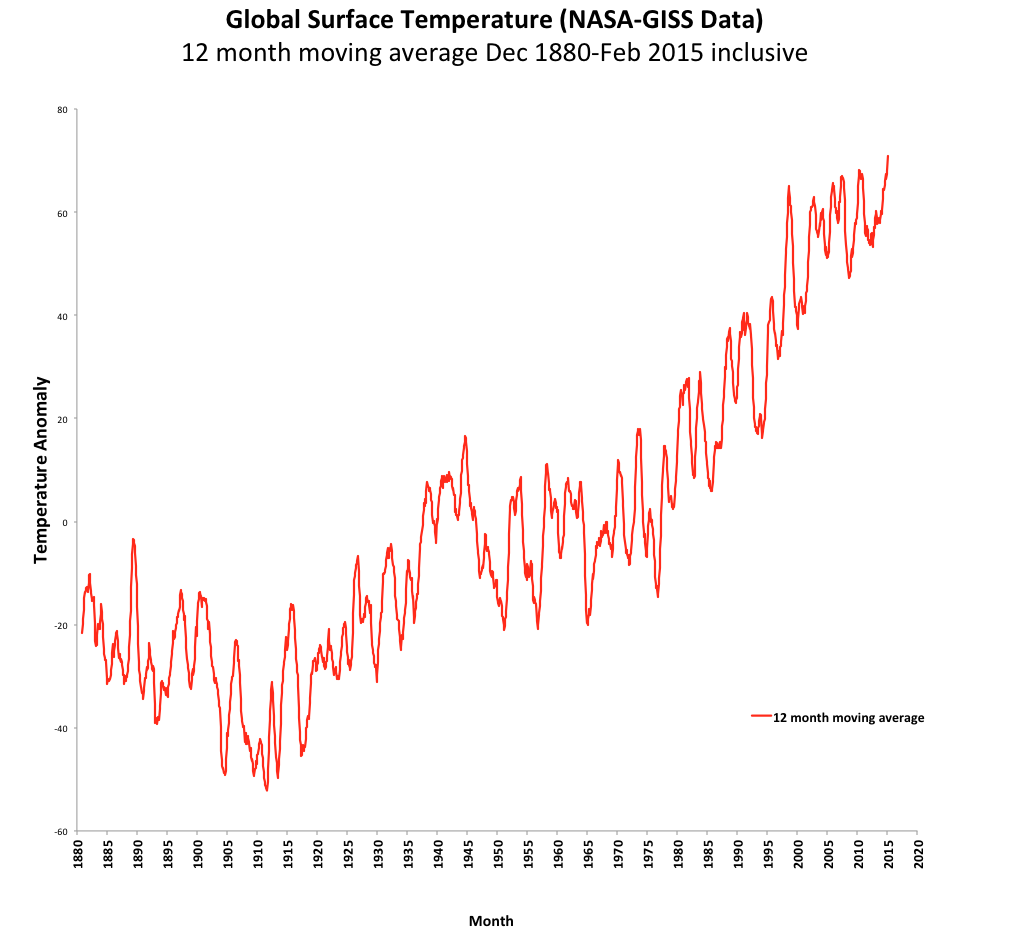
NASA reported this weekend that last month was the second-hottest February on record, which now makes March 2014–February 2015 the hottest 12 months on record. This is using a 12-month moving average, so we can “see the march of temperature change over time,” rather than just once every calendar year.

We are experiencing the continuation of the global warming trend that made 2014 the hottest calendar year on record. The very latest science says we should expect an acceleration in surface temperature warming to start quite soon. What is happening now is consistent with that.


Once again February has been cold for those of us living in the eastern and northeastern U.S. — and once again, the rest of the country and the globe is quite warm, with large parts of Asia and Alaska experiencing nearly off-the-charts heat. That’s clear in the NASA chart below for February temperatures, whose upper range extends to a whopping 8.4°C (15.1°F) above the 1951-1980 average!

2015 might beat 2014! Maybe our first .7c year??? We will see.
The OP is a moron.

All you have is insults. Poor little anti-science loserterian fool. lol

Can you prove that the past 12 months weren't the warmest? The datasets seem to show that it was.

Your just a moron trolling for grant money from dumb asses that are willing to pay you for your sky is falling bullshit.

010405m2.gif


500_million_temperature_gross.png
holy crap RK the sun makes the earth warm. I don't think the left on here will want to see that chart.
 
Your just a moron trolling for grant money from dumb asses that are willing to pay you for your sky is falling bullshit.

Why is it that every denier male here is so whiny and butthurt all the time? I see a chicken or egg issue. That is, are those of a sissified nature drawn to the denier cult, or does the denier cult cause normal men to turn into sissies?

RK's first graph is fudged, of course, in the way it deliberately omits data. The fact that it cut off 10 years ago should be a clue. Since then, solar cycle length went way up. If the graph went out to 2014, the solar cycle line would have plunged away from the temp line.

Oops. So much for that idiot theory. That illustrates the problem with doing science by short-term curve-fitting, which is basically all deniers do.


As for this one, it's a standard hilarious denier failure. 500 million years ago, the sun was 4% dimmer. If CO2 levels weren't high, the earth would have frozen. Heck, the earth did freeze into Snowball Earth when CO2 levels were low. Poor RK doesn't get how his chart there illustrates so well the greehouse gas effect of CO2.

4% dimmer? link?

The sun was also about 47 thousand miles closer to the earth 500m years ago so you might need to shave your 4% a bit. And the earth's core was probably a bit hotter no?
 
Formation and evolution of the Solar System - Wikipedia the free encyclopedia
---
In the long term, the greatest changes in the Solar System will come from changes in the Sun itself as it ages. As the Sun burns through its supply of hydrogen fuel, it gets hotter and burns the remaining fuel even faster. As a result, the Sun is growing brighter at a rate of ten percent every 1.1 billion years
---

500 million years is more like 4.5%, but call it 4%.

47,000 miles compared to 93 million is 0.05%. Radiation difference of 0.1%. Insignificant compared to the changes in the sun itself.

Heat energy from the earth's core makes up 0.03% of the heat budget. It might have been 0.04% 500 million years ago. Again, insignificant compared to the changes in the sun.

Earth s internal heat budget - Wikipedia the free encyclopedia

400px-Evolution_of_Earth%27s_radiogenic_heat.jpg
Can I quote you on .1% is insignificant compared to changes in the sun itself? I'd like to use that when we cover the delta increase in heat caused by green house gases due to human interactions.
 
If the sun were regularly fluctuating now by 4%, that might make sense.

But, since the sun only fluctuates by around 0.1% over a sunspot cycle now, calling 0.1% insignificant in comparison to 0.1% makes no sense at all.
 
If the sun were regularly fluctuating now by 4%, that might make sense.

But, since the sun only fluctuates by around 0.1% over a sunspot cycle now, calling 0.1% insignificant in comparison to 0.1% makes no sense at all.
So that would be a no, I can't quote you on your statement that ".1% is insignificant compared to changes in the sun itself." I can't quote you on your statement because as you say, "calling 0.1% insignificant ... makes no sense at all." Wait oh ok you are saying .1% is significant when it serves your agenda. Oh ok I get it now.
 
is it just me who thinks that the water cycle system, that has kept the Earth in the Goldilocks Zone for billions of years even though the Sun has changed over 10% in output, won't suddenly collapse because of an extra wisp of a trace gas that has historically been much higher?
 

Forum List

Back
Top