My global temperature forecast for 2020 revised downward

ScienceRocks

Democrat all the way!
Mar 16, 2010
59,455
6,793
1,900
The Good insane United states of America
Yep, it's now appearing that we're no longer following the .13-.15c per decade trend that would take us from .545, 2010 to .67-.695 by 2020 for the global means temperature. I'm not sure what root to believe 1# energy being stored deep in oceans Andrew Dauser or 2# Spencer theory of an increase in cloud cover reflecting it back into space. I'm going to play it safe in believe that the energy that's we know of is the main player and forecast the trend closer to .62-.64 by 2020. Avg means of .63c...

Some of the factors why I believe this
1# Most of the warming has occurred within the Arctic with very little throughout the remainder of the world. Most of it is being caused by arctic amplification of the exposed area of arctic ocean without ice. I believe look at increase in snowfall during the winter into spring should cause that time period to remain around 13-15 million sq miles of sea ice. While the summer and fall should grow with a steeper difference. Pretty much I expect by 2015 that sea ice during the minimum to reach ~3.2 million miles for avg summer sea ice and 2.7 million miles for avg sea ice by 2020. This will lead 80% of the global temperature increase. So the increase in snow fall during the winter-spring will be a negative on the warming.

2# By 2015-2018 period we will start tracking into the next solar minimum. This one after this weak one could put a negative effect on the climate system.

3# Overall cool ENSO period like 1970's. This will have some effect over the next 3-8 years. .03c mean negative factor.

I see no increase in the rate of warming...In fact I see a flatting of the slope(decreasing rate of increase). I think a case could be made that the warming could be down to around .07-.09c per year from .013-.015c, 5 years ago and .018c/year in the late 1990's. Of course we won't know for sure until the middle part of this decade based on the rules of stats. :eusa_whistle:
 
  • Thread starter
  • Banned
  • #2
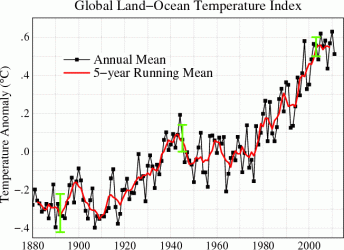
As you can see between 1976-2004 we seen a rapid rate of warming of around .15-.2/decade. But since 2004 we have been slowing down the rate of warming in a lot of the same way as we did in 1945.

Doesn't mean global warming is stopping as the IPCC says since 1940 that most of the warming is caused by co2. I will guess that this could be a short slow down...Either way it will take a decade to know for sure.
 

Attachments

  • $Fig_A2.gif
    $Fig_A2.gif
    30.7 KB · Views: 92
Last edited:
I think that your estimate of the amount of melt in the Arctic is far on the conservative side, and that the effects of that melt will lead to a much larger increase in the temps than predicted at present. Guess we will see.
 
3.2 million square kilometers, for the 9th of August. And the curve, at present, is headed nearly straight down. Plus the effects of an Arctic storm that may increase the melting by the dispersal of the ice into smaller, easier to melt peices.
 
Granny says, "Dat's right we all gonna die o' thirst `cause o' dat global warmin'...
:eusa_eh:
Global Warming Might Threaten Water Supply
November 11, 2012 - Global warming over the next century could significantly reduce the amount of winter snowpack in mountainous areas in the northern hemisphere, according to a new study published in Nature Climate Change.
Seasonal snowpack melt is an essential source of fresh water, and its loss could threaten drinking water supplies, agricultural irrigation and wildlife ecosystems. Stanford University climate expert Noah Diffenbaugh led the study, which compares snowpack conditions across the northern hemisphere in the late 20th century with climate model projections for the next one hundred years.

Deceasing snowpack

Those projections are based on a range of scenarios which foresee a rise in average global temperatures of between two and four degrees Celsius. The study concludes that average snow accumulation will decrease in most regions of the Western United States, Europe, Central Asia and the Himalayas, compared to historical patterns.

It projects that low and extremely low snow falls would exceed the lows of the later 20th century between 10 and 30 percent of the time with two degrees of warming. And, Diffenbaugh says, "If the planet warms by 4 degrees Celsius, the United could experience snowpack accumulations below the levels of the late 20th century up to 80 percent of the years.” The story is the same in other parts of the northern hemisphere, where snowpack is a natural, and critical, water reservoir.

Water worries

The study finds that an early spring melt would bring more water into the watershed sooner than usual, potentially flooding rivers, lakes and artificially dammed-river reservoirs. And with less water available later in the season, chances for more wildfires, pests, and species extinctions increase. Diffenbaugh says this timing would also exacerbate drought conditions when the demand for water is greatest. “We can infer that should these physical climate changes occur in the future, that there would be impacts on water supply for agriculture and for human consumption and for natural ecosystems if the water storage and management systems are not adapted to those changes.”

MORE

The cardinal rule in medicine is "First, do no harm." It really seems that the cardinal rule in climate science is "First, ignore the facts".

It seems that every one of these climate of doom reports contains more qualifiers than facts. They are chock full of wiggle words like could, forsee, might, project and the ever popular (and necessary) team of model and if.

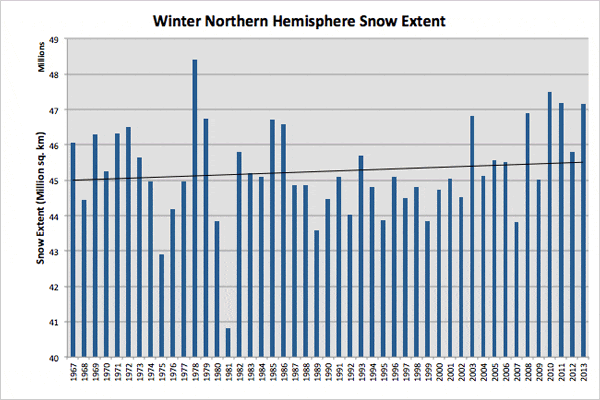
Where (in the real world) do they get the idea that the northern hemisphere snowpack is decreasing? If the looked out the window once in a while, they might get a clue that the snowpack in the northern hemisphere is on the increase and has been for quite some time.

Are they, in their computer labs, completely unaware that three of the four snowiest winters ever recorded have been within the past five years? Did they miss the couple of weeks two years ago when there was a measurable accumulation of snow in 49 of the 50 states simultaneously. Have they missed the record winter snowfalls across europe and eurasia?

Here, from the global snow lab at Rutgers University:

nhland_season1.gif
 
If you get a good snowpack, you get growing glaciers. Virtually all of our glaciers are shrinking. Snowfall and snowpack are two differant things. In the Cascades, we have had many good years of snowfall, only to see it melt off earlier in the spring every decade.

A warmer atmosphere holds more water, and the areas that get snow in the winter will get more snow, but at a warmer temperature.

ESRL/GMD Barrow Snowmelt Date

An Error Occurred Setting Your User Cookie

Abstract


Analyses of streamflow, snow mass temperature, and precipitation in snowmelt-dominated river basins in the western United States indicate an advance in the timing of peak spring season flows over the past 50 years. Warm temperature spells in spring have occurred much earlier in recent years, which explains in part the trend in the timing of the spring peak flow. In addition, a decrease in snow water equivalent and a general increase in winter precipitation are evident for many stations in the western United States. It appears that in recent decades more of the precipitation is coming as rain rather than snow. The trends are strongest at lower elevations and in the Pacific Northwest region, where winter temperatures are closer to the melting point; it appears that in this region in particular, modest shifts in temperature are capable of forcing large shifts in basin hydrologic response. It is speculated that these trends could be potentially a manifestation of the general global warming trend in recent decades and also due to enhanced ENSO activity. The observed trends in hydroclimatology over the western United States can have significant impacts on water resources planning and management.
 
If you get a good snowpack, you get growing glaciers. Virtually all of our glaciers are shrinking. Snowfall and snowpack are two differant things. In the Cascades, we have had many good years of snowfall, only to see it melt off earlier in the spring every decade.

What is it that you want? Do you wish to remain in the presently chilly global conditions forever? Are you wishing for stagnant, never changing climate? Or maybe go back to the good old days of glaciers covering half of the northern hemisphere?

What exactly do you want? Personally, I would like to see temps akin to the holocene maximum come around. If we were beings that lived for eons, we would, at present be anticipating spring and summer after an altogether to long winter.

Exactly what is it that makes you believe that the earth is presently at the ideal temperature and what makes you believe that we have any control whatsoever over the temperature the earth is going to be?
 
Yep, it's now appearing that we're no longer following the .13-.15c per decade trend that would take us from .545, 2010 to .67-.695 by 2020 for the global means temperature. I'm not sure what root to believe 1# energy being stored deep in oceans Andrew Dauser or 2# Spencer theory of an increase in cloud cover reflecting it back into space. I'm going to play it safe in believe that the energy that's we know of is the main player and forecast the trend closer to .62-.64 by 2020. Avg means of .63c...

Some of the factors why I believe this
1# Most of the warming has occurred within the Arctic with very little throughout the remainder of the world. Most of it is being caused by arctic amplification of the exposed area of arctic ocean without ice. I believe look at increase in snowfall during the winter into spring should cause that time period to remain around 13-15 million sq miles of sea ice. While the summer and fall should grow with a steeper difference. Pretty much I expect by 2015 that sea ice during the minimum to reach ~3.2 million miles for avg summer sea ice and 2.7 million miles for avg sea ice by 2020. This will lead 80% of the global temperature increase. So the increase in snow fall during the winter-spring will be a negative on the warming.

2# By 2015-2018 period we will start tracking into the next solar minimum. This one after this weak one could put a negative effect on the climate system.

3# Overall cool ENSO period like 1970's. This will have some effect over the next 3-8 years. .03c mean negative factor.

I see no increase in the rate of warming...In fact I see a flatting of the slope(decreasing rate of increase). I think a case could be made that the warming could be down to around .07-.09c per year from .013-.015c, 5 years ago and .018c/year in the late 1990's. Of course we won't know for sure until the middle part of this decade based on the rules of stats. :eusa_whistle:

:lol: The meterologists can't even predict the temperatures next week, never mind next year or 20 years from now.

Who are you the great profit of weather?

I don't know if the changes in our climate are nautrual or made by man but I do know that you can't predict what you are trying to. Scientists who did so back in the early 90's about today were wrong.
 
I think that your estimate of the amount of melt in the Arctic is far on the conservative side, and that the effects of that melt will lead to a much larger increase in the temps than predicted at present. Guess we will see.

THere is little doubt that the present reduction in arctic ice is due to changing wind and not temperature as warmists like to believe.

2012 Arctic Ice Melt Claims Distorted And Inaccurate. It
Arctic (Non) Warming Since 1958 | Watts Up With That?
NASA - Multimedia - Video Gallery
Wind contributing to Arctic sea ice loss, study finds | Environment | guardian.co.uk
Russian river water affecting the Arctic – AO shift blamed | Watts Up With That?
 
Yep, it's now appearing that we're no longer following the .13-.15c per decade trend that would take us from .545, 2010 to .67-.695 by 2020 for the global means temperature. I'm not sure what root to believe 1# energy being stored deep in oceans Andrew Dauser or 2# Spencer theory of an increase in cloud cover reflecting it back into space. I'm going to play it safe in believe that the energy that's we know of is the main player and forecast the trend closer to .62-.64 by 2020. Avg means of .63c...

Some of the factors why I believe this
1# Most of the warming has occurred within the Arctic with very little throughout the remainder of the world. Most of it is being caused by arctic amplification of the exposed area of arctic ocean without ice. I believe look at increase in snowfall during the winter into spring should cause that time period to remain around 13-15 million sq miles of sea ice. While the summer and fall should grow with a steeper difference. Pretty much I expect by 2015 that sea ice during the minimum to reach ~3.2 million miles for avg summer sea ice and 2.7 million miles for avg sea ice by 2020. This will lead 80% of the global temperature increase. So the increase in snow fall during the winter-spring will be a negative on the warming.

2# By 2015-2018 period we will start tracking into the next solar minimum. This one after this weak one could put a negative effect on the climate system.

3# Overall cool ENSO period like 1970's. This will have some effect over the next 3-8 years. .03c mean negative factor.

I see no increase in the rate of warming...In fact I see a flatting of the slope(decreasing rate of increase). I think a case could be made that the warming could be down to around .07-.09c per year from .013-.015c, 5 years ago and .018c/year in the late 1990's. Of course we won't know for sure until the middle part of this decade based on the rules of stats. :eusa_whistle:
I'm wondering what happens if/when the permafrost melts AND if/when enough natural gas currently captured in the deep ocean as a liquid, starts gasifying and adds to the greenhouse effect.

Or are those events and their probably consequences already part of your model's projections, Matthew?
 
I'm wondering what happens if/when the permafrost melts AND if/when enough natural gas currently captured in the deep ocean as a liquid, starts gasifying and adds to the greenhouse effect.

Or are those events and their probably consequences already part of your model's projections, Matthew?

Can you describe how you believe that the "greenhouse" effect works and direct me to some actual evidence supporting those workings in an open atmosphere? The reason I ask is that it seems that as one mode of operation for the greenhouse effect is debunked, another seems to pop up. Presently there are about 6 hypotheses floating around, none of which are supported by any experimental evidence. I am just curious as to which one you subscribe to.
 
Last edited:
Yep, it's now appearing that we're no longer following the .13-.15c per decade trend that would take us from .545, 2010 to .67-.695 by 2020 for the global means temperature. I'm not sure what root to believe 1# energy being stored deep in oceans Andrew Dauser or 2# Spencer theory of an increase in cloud cover reflecting it back into space. I'm going to play it safe in believe that the energy that's we know of is the main player and forecast the trend closer to .62-.64 by 2020. Avg means of .63c...

Some of the factors why I believe this
1# Most of the warming has occurred within the Arctic with very little throughout the remainder of the world. Most of it is being caused by arctic amplification of the exposed area of arctic ocean without ice. I believe look at increase in snowfall during the winter into spring should cause that time period to remain around 13-15 million sq miles of sea ice. While the summer and fall should grow with a steeper difference. Pretty much I expect by 2015 that sea ice during the minimum to reach ~3.2 million miles for avg summer sea ice and 2.7 million miles for avg sea ice by 2020. This will lead 80% of the global temperature increase. So the increase in snow fall during the winter-spring will be a negative on the warming.

2# By 2015-2018 period we will start tracking into the next solar minimum. This one after this weak one could put a negative effect on the climate system.

3# Overall cool ENSO period like 1970's. This will have some effect over the next 3-8 years. .03c mean negative factor.

I see no increase in the rate of warming...In fact I see a flatting of the slope(decreasing rate of increase). I think a case could be made that the warming could be down to around .07-.09c per year from .013-.015c, 5 years ago and .018c/year in the late 1990's. Of course we won't know for sure until the middle part of this decade based on the rules of stats. :eusa_whistle:

I'm wondering what happens if/when the permafrost melts AND if/when enough natural gas currently captured in the deep ocean as a liquid, starts gasifying and adds to the greenhouse effect.

Or are those events and their probably consequences already part of your model's projections, Matthew?


The MWP was warmer and no catastrophe happened. The Holocene Thermal max was even warmer and once again nothing happened. The "Methane Catastrophe" is just another in a long line of "end of the world" prognostications foisted on the world by the latest iteration of charlatans.
 
Granny says is from the heat from all dem hot-blooded illegal Hispexicans...
:eusa_eh:
US roasts to hottest year on record by landslide
8 Jan.`13 WASHINGTON (AP) — America set an off-the-charts heat record in 2012.
A brutal combination of a widespread drought and a mostly absent winter pushed the average annual U.S. temperature last year up to 55.32 degrees Fahrenheit, the government announced Tuesday. That's a full degree warmer than the old record set in 1998. Breaking temperature records by an entire degree is unprecedented, scientists say. Normally, records are broken by a tenth of a degree or so. "It was off the chart," said Deke Arndt, head of climate monitoring at the National Climatic Data Center in Asheville, N.C., which calculated the temperature records. Last year, he said, will go down as "a huge exclamation point at the end of a couple decades of warming."

The data center's figures for the entire world won't come out until next week, but through the first 11 months of 2012, the world was on pace to have its eighth warmest year on record. Scientists say the U.S. heat is part global warming in action and natural weather variations. The drought that struck almost two-thirds of the nation and a La Nina weather event helped push temperatures higher, along with climate change from man-made greenhouse gas emissions, said Katharine Hayhoe, director of the Climate Science Center at Texas Tech University. She said temperature increases are happening faster than scientists predicted. "These records do not occur like this in an unchanging climate," said Kevin Trenberth, head of climate analysis at the National Center for Atmospheric Research in Boulder, Colo. "And they are costing many billions of dollars."

Global warming is caused by the burning of fossil fuels — coal, oil and natural gas — which sends heat-trapping gases, such as carbon dioxide, into the air, changing the climate, scientists say. What's happening with temperatures in the United States is consistent with the long-term pattern of "big heat events that reach into new levels of intensity," Arndt said. Last year was 3.2 degrees warmer than the average for the entire 20th century. Last July was the hottest month on record. Nineteen states set yearly heat records in 2012, though Alaska was cooler than average.

U.S. temperature records go back to 1895 and the yearly average is based on reports from more than 1,200 weather stations across the Lower 48 states. Several environmental groups, including the World Wildlife Fund, took the opportunity to call on the Obama Administration to do more to fight climate change. According to the National Oceanic and Atmospheric Administration, 2012 also had the second-most weather extremes on record after hurricane-heavy 1998, based on a complex mathematical formula that includes temperature records, drought, downpours, and land-falling hurricanes.

MORE
 
Yep, it's now appearing that we're no longer following the .13-.15c per decade trend that would take us from .545, 2010 to .67-.695 by 2020 for the global means temperature. I'm not sure what root to believe 1# energy being stored deep in oceans Andrew Dauser or 2# Spencer theory of an increase in cloud cover reflecting it back into space. I'm going to play it safe in believe that the energy that's we know of is the main player and forecast the trend closer to .62-.64 by 2020. Avg means of .63c...

Some of the factors why I believe this
1# Most of the warming has occurred within the Arctic with very little throughout the remainder of the world. Most of it is being caused by arctic amplification of the exposed area of arctic ocean without ice. I believe look at increase in snowfall during the winter into spring should cause that time period to remain around 13-15 million sq miles of sea ice. While the summer and fall should grow with a steeper difference. Pretty much I expect by 2015 that sea ice during the minimum to reach ~3.2 million miles for avg summer sea ice and 2.7 million miles for avg sea ice by 2020. This will lead 80% of the global temperature increase. So the increase in snow fall during the winter-spring will be a negative on the warming.

2# By 2015-2018 period we will start tracking into the next solar minimum. This one after this weak one could put a negative effect on the climate system.

3# Overall cool ENSO period like 1970's. This will have some effect over the next 3-8 years. .03c mean negative factor.

I see no increase in the rate of warming...In fact I see a flatting of the slope(decreasing rate of increase). I think a case could be made that the warming could be down to around .07-.09c per year from .013-.015c, 5 years ago and .018c/year in the late 1990's. Of course we won't know for sure until the middle part of this decade based on the rules of stats. :eusa_whistle:

Love the avatar!

I believe, if we get and ENSO event or PDO change, the arctic sea ice is gone.

We've lost 6 million square kilometers of snow cover at June in the Northern Hemisphere. That's like three Greenlands or the amount of arctic sea ice that remains. I'm not going to spell it out, how the wind is different and they melt ice.

Expect to find in the future those every 150 events happening in Greenland. Unless this Earth gets a volcanic eruption, it has big proplems.

Scientists are just suppose to tell you shit. They aren't God and they aren't Prophets. You am what you are am.
 
There is a vast differance in albedo between plants, rocks, and soil, and that of snow. The amount of extra energy absorbed, instead of being reflected back into space is significant.

As the ice disappears in the Actic Ocean, the clathrates are starting to outgas. While the GHG potential of CH4 is often stated as 20+ times that of CO2, that is over a 100 year period. Over a decade, it is over 70 times as effective of a GHG as CO2.

And right now we have 1800 ppb of CH4 in the atmosphere. That is an increase of over 1000 ppb in the last 150 years. That means that right now, the increase in CH4 is equal to over 70 ppm of CO2. And, since we are already at 395+ ppm of CO2, that means the equivelant level is really over 450 ppm, and that is not even considering the industrial GHGs.

People, we are now going to be faced with increasingly severe consequences. And, since nobody is going to do a damned thing to cut back the emissions, worldwide, it will get worse for a long time.

It makes sense to me, Old Rocks!
 

Forum List

Back
Top