Navigation
Install the app
How to install the app on iOS
Follow along with the video below to see how to install our site as a web app on your home screen.

Note: This feature currently requires accessing the site using the built-in Safari browser.
More options
You are using an out of date browser. It may not display this or other websites correctly.
You should upgrade or use an alternative browser.
You should upgrade or use an alternative browser.
More Magic Marker Mania from Hansen over at GISS
- Thread starter IanC
- Start date

old graph

april graph

today's graph. not much change but I see 1/4C is knocked off the top readings since april. bits and bites- every new handful is different
edit- ooops! a whole chunk is missing. what happened to the pre-1910 data?
I'm really replying just to crib your sources on the graphs.. Seems like they change more often than my daughter's hair color.. This one tho -- DID NEED some kind of correction in the 1970 timeframe.. But my guess is -- like Darwin -- they SHOULD HAVE chosen the lower mean value as the better choice. Looks like the station moved from a hotter to cooler place.. Which is right? Usually the cooler place...

A reminder of another Hansen spelled Hanssen. The FBI never knew he was a traitor until they became aware the lavish perks that showed up. Scientists are no different. They will sell their souls with false data as song as long as the big ticket federal grants keep rolling in.
Big Fitz
User Quit *****
- Nov 23, 2009
- 16,917
- 2,522
- 48
I've been bringing up Surfacestations.org for a while now. The cargo cult of chicken little climate change ignores it and says it's irrelevant or 'adjusted' out.another one


- Thread starter
- #45
old graph
april graph
today's graph. not much change but I see 1/4C is knocked off the top readings since april. bits and bites- every new handful is different
edit- ooops! a whole chunk is missing. what happened to the pre-1910 data?
I'm really replying just to crib your sources on the graphs.. Seems like they change more often than my daughter's hair color.. This one tho -- DID NEED some kind of correction in the 1970 timeframe.. But my guess is -- like Darwin -- they SHOULD HAVE chosen the lower mean value as the better choice. Looks like the station moved from a hotter to cooler place.. Which is right? Usually the cooler place...
the web site 'not a lot of people know that' has some really interesting stuff on temp data sets.
a lot of the other comparisons I posted were just googling an older GISS graph and looking at todays version. a while back I downloaded historical US data from early 2000's, several sets around summer 2007 (Y2K bug corrections) and recent ones on the wayback machine. the change was dramatic. GISS does whatever they want, and what they want is for the temps and trends to go up.
- Thread starter
- #46
reprise from the OP

what an interesting set of adjustments! it would be informative to hear the reasons for some of them, like why the early '80s jumped back and forth from a plus 1.25C adjustment to a minus 1.75C adjustment the next year, then back to zero (ish)
if the graph isnt showing you can go to http://www.real-science.com/wp-content/uploads/2012/01/ScreenHunter_09-Jan.-15-16.43.jpg
Last edited:
- Thread starter
- #48
a few of your pics come up as red x's for me.
sorry about that. first the GISS graphs disappear, now real-science has disabled hyperlinks. you can get the addy from properties
- Thread starter
- #49
I really find it hard to believe how no one seems to pay attention to this stuff.
Iceland is a Western country with a stable govt and good records. their temperature data is adjusted over and over and over again, all to increase the temperature trend upwards. when questioned why the adjustments have been made, GHCN trots out their methodology but none of it applies. any station moves have already been adjusted for in the Iceland records by the local Met. corrections that are made for 'spurious' temp drops are incorrect because the neighbouring stations also had the same temp drops. the 60s and 70s were adjusted up even though historical records show that Iceland suffered heavily because of the 'Sea Ice Years'.
if a country with meticulous records can have all these increases added to their records against their wishes, why should we have any trust in countries that have bad recordkeeping and no interest? do you really believe that most of the African entries into the global network have any resemblance to the actual climate?
GHCN Adjustments In Iceland « NOT A LOT OF PEOPLE KNOW THAT
there is the link to the Iceland story. if you still have full trust in global temperature data sets after reading it, then 'gullible' and 'credulous' are words to describe you. if anyone is interested we could talk about the new crutemp version 4
daveman
Diamond Member
The Troo Beleevers are not allowed to look at heresy. They'll face the fires of damnation.I really find it hard to believe how no one seems to pay attention to this stuff.
- Thread starter
- #51
Yesterday, NCDC released Version 2.5 of the USHCN data set.
the raw difference between version 2.0 and 2.5
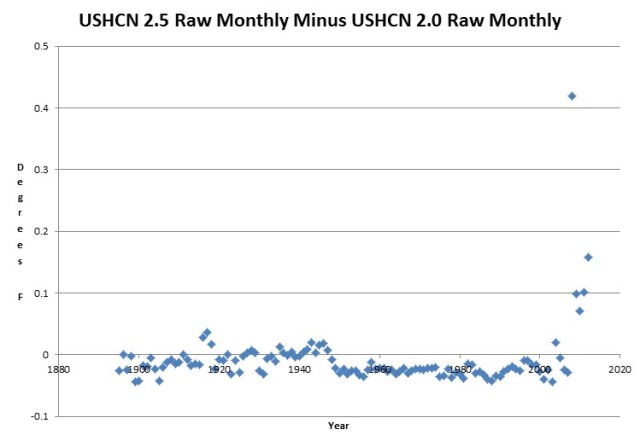
why is there a hockeystick change on the 2000's? I guess because they can cange anything they want without consequence, so they do.
the raw difference between version 2.0 and 2.5
why is there a hockeystick change on the 2000's? I guess because they can cange anything they want without consequence, so they do.
A significant number of folks are watching multiple iterations on 60 year data. It's not complicated. It's JUST temperature data... And the station MOVES and consolidations are well documented.
Looks very expensive to me also... Must be a lot of monkey's typing...
This is the same out of control editing that is being done on satellite sensors now -- sometimes over the vehement objections of the DESIGNERS of those measurement instruments..
If we have plateaued out on temp rise for a couple decades - expect to see even more desparate measures and EVENTUALLY they will over-step and the press will wake up again for a broadcast or two...
Yesterday, NCDC released Version 2.5 of the USHCN data set.
the raw difference between version 2.0 and 2.5
why is there a hockeystick change on the 2000's? I guess because they can cange anything they want without consequence, so they do.
Wow..!!! It`s one thing to "polish" data, but that ...? The only way I could describe it is using a German phrase "Luegen bis sich die Balken biegen" (short translation...lies can bend (straight) I-beams...to a hockey stick.)
While I`m here I want to run something by You and flacaltenn.
I`m sure You both know that CO2 can absorb only so much and no more IR at the absorption wavelength. Regardless if You have 100 ppm or 1000 ppm if the path length is long enough it absorbed all it possibly could...agreed? So in (climatology) theory all the IR at the CO2 absorption bands should have been "stripped" from the incoming sunlight.
But that is not so...!!.....because if it were then this should not be possible:
CO2 greenhouse gas experiment - YouTube
Yes it`s just a $250 Bushnell reflector scope but the mirror is a "chroma corrected mirror" which means it does not alter the color (speak wavelength) of light.
And it sure as heck is not a "black body" but an almost ideal reflector.
So why then did the temperature in the tube climb by 2.5 C after the air in the tube was replaced with CO2...?
Where do the photons at this wavelength come from (?) that should have been gone when the down coming solar radiation passed through the 370 or so ppm CO2 atmosphere and the thin overcast...yet they were there to be absorbed by the CO2 in the telescope tube....and again, no way did the mirror in the telescope tube frequency shift any of the incoming solar light...!!!
See, this is why these "green house gas" experiments are so misleading and why the assertion that more CO2 means a higher temperature is no more than a cheap magicians trick...!!!
100% absorption in IR spectroscopy means that the gas in the light path has already absorbed all the energy it can...and not that it has absorbed 100 % of the energy which the IR radiation has at this wavelength...the way climatologists and their computer models calculate.
As You can see, all You have to do is "stack" another tube full of CO2 to the path to get the same effect as You would if there was no CO2 in the atmosphere above at all.
According to these computer models the "extra CO2" is absorbing all the "extra energy" it gets from a warm "black body" at this wavelength on the up- path.
Now couple that with the IR remote control video
[ame="http://www.youtube.com/watch?v=BpFsUdYZdUE&list=UUvj7dbOY14kt_MFIR1Y1iwA&index=3&feature=plcp"]Backradiation Climate Skeptic - YouTube[/ame]
what it really would take for the kind of "black body" climate computer models assume for the "average" earth surface.
If You don`t believe me I`ll do this experiment on camera with a second card board tube full of CO2 stacked on the telescope...which I have done ~ 10 years ago...and basically got the same results as with one tube.
To sum it up what I`m saying is that whatever CO2 does contribute to the overall temperature, it has done so at already at much lower CO2 levels in pre- industrial times ( in the sufficiently long down path length) and the extra ppm we added to it does not absorb "X % of extra energy" to raise the temperature.
It`s a typical case of a misleading definition what X % is.. X% of what ???
...and that hopefully explains why I was (since 10 years after the first experiment) and (now) still am a "denier"
Similar threads
- Replies
- 382
- Views
- 56K
- Replies
- 132
- Views
- 8K
Latest Discussions
- Replies
- 217
- Views
- 865
- Replies
- 649
- Views
- 7K
- Replies
- 2
- Views
- 3
Forum List
-
-
-
-
-
Political Satire 8037
-
-
-
-
-
-
-
-
-
-
-
-
-
-
-
-
-
-
-
ObamaCare 781
-
-
-
-
-
-
-
-
-
-
-
Member Usernotes 468
-
-
-
-
-
-
-
-
-
-