Uncensored2008
Libertarian Radical
hmmm, both you and Econchick seem to be saying you won't accept any charts or graphs at all because you're assuming dishonesty on the part of whoever is posting the graph.
I only speak for myself, but the hate sites are renowned for dishonesty. I generally distrust any cite that does not link to the source. ThinkProgess producing a graph and claiming the numbers come from the BLS has little impact on me, because I know ThinkProgress is dishonest and will manipulate or openly fabricate data.
That seems odd, since the whole point of this thread is Econchick stating as fact the results of a graph from investors.com (and the IBD) but both say they got their info from Sentier Research who claims they got it from BLS microdata. Microdata is not publicly released and cannot be double checked.
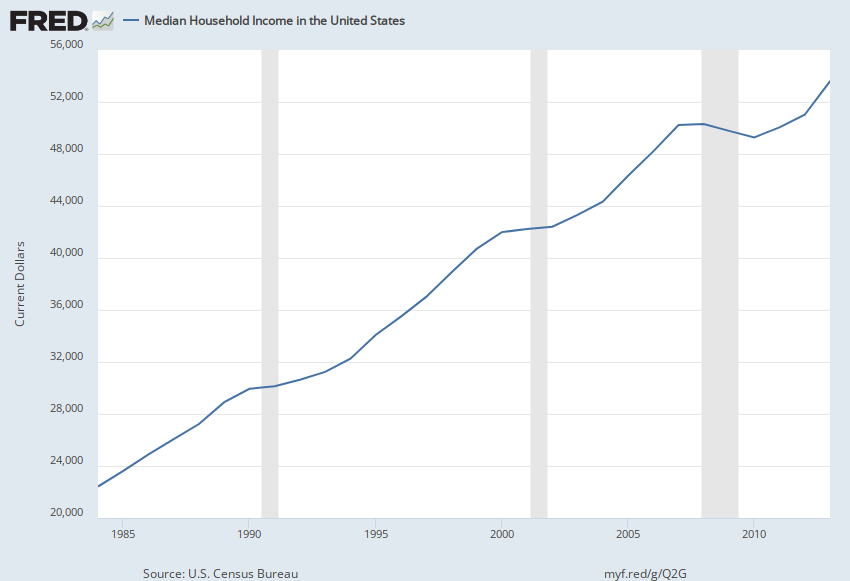
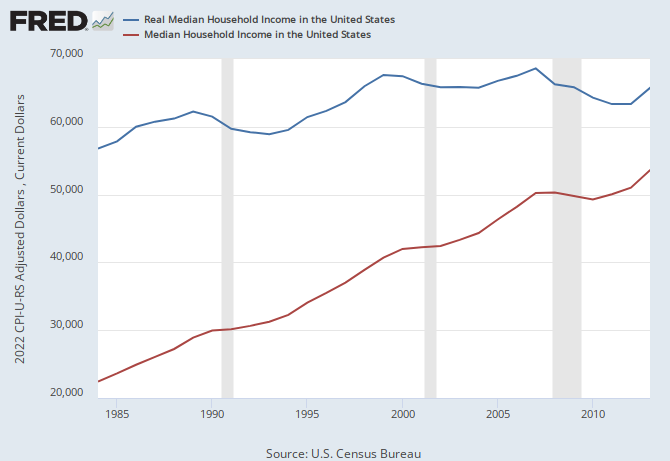
Personally, I see no reason to doubt their conclusions, which match the more time lagged officially produced data from different Census surveys.
Credibility of the source is important. I know that investors.com is a reputable outfit, just as I know the Soros sites are disreputable.