asterism
Congress != Progress
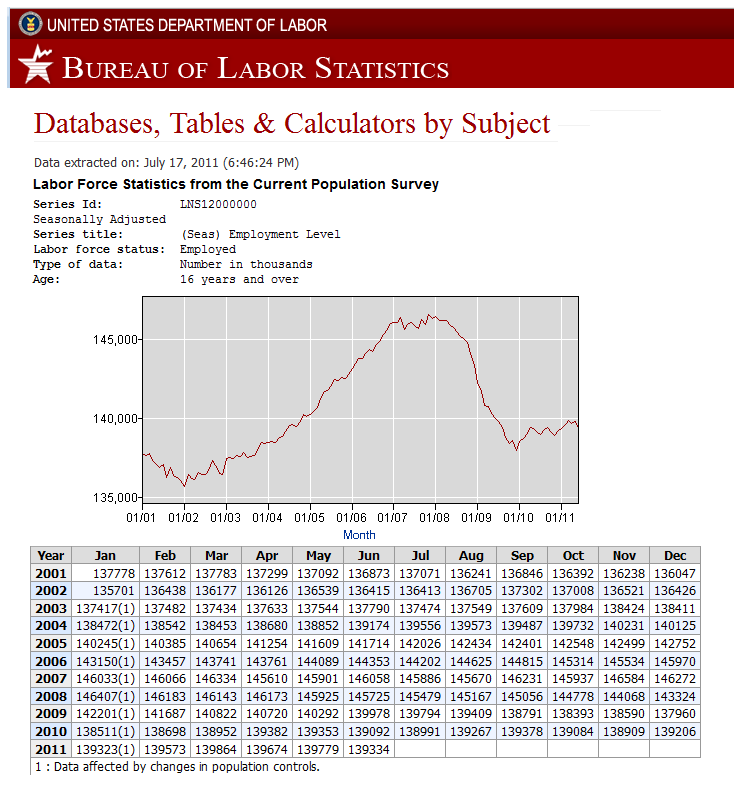
Lost jobs under Bush and gained jobs under Obama are both myths.
During the Bush years net job gain was over 4.4 million.
During the Obama years total net job loss is over 2.8 million.
The data:
Year Jan Feb Mar Apr May Jun Jul Aug Sep Oct Nov Dec
2001 164 -166 171 -484 -207 -219 198 -830 605 -454 -154 -191
2002 -346 737 -261 -51 413 -124 -2 292 597 -294 -487 -95
2003 991(1) 65(1) -48 199 -89 246 -316 75 60 375 440 -13
2004 61(1) 70(1) -89 227 172 322 382 17 -86 245 499 -106
2005 120(1) 140(1) 269 600 355 105 312 408 -33 147 -49 253
2006 398(1) 307(1) 284 20 328 264 -151 423 190 499 220 436
2007 63(1) 33(1) 268 -724 291 157 -172 -216 561 -294 647 -312
2008 135(1) -224(1) -40 30 -248 -200 -246 -312 -111 -278 -710 -744
2009 -1123(1) -514(1) -865 -102 -428 -314 -184 -385 -618 -398 197 -630
2010 551(1) 187(1) 254 430 -29 -261 -101 276 111 -294 -175 297
2011 117(1) 250(1) 291 -190 105 -445
1 : Data affected by changes in population controls.

Bureau of Labor Statistics Data
During the Bush years net job gain was over 4.4 million.
During the Obama years total net job loss is over 2.8 million.
The data:
Year Jan Feb Mar Apr May Jun Jul Aug Sep Oct Nov Dec
2001 164 -166 171 -484 -207 -219 198 -830 605 -454 -154 -191
2002 -346 737 -261 -51 413 -124 -2 292 597 -294 -487 -95
2003 991(1) 65(1) -48 199 -89 246 -316 75 60 375 440 -13
2004 61(1) 70(1) -89 227 172 322 382 17 -86 245 499 -106
2005 120(1) 140(1) 269 600 355 105 312 408 -33 147 -49 253
2006 398(1) 307(1) 284 20 328 264 -151 423 190 499 220 436
2007 63(1) 33(1) 268 -724 291 157 -172 -216 561 -294 647 -312
2008 135(1) -224(1) -40 30 -248 -200 -246 -312 -111 -278 -710 -744
2009 -1123(1) -514(1) -865 -102 -428 -314 -184 -385 -618 -398 197 -630
2010 551(1) 187(1) 254 430 -29 -261 -101 276 111 -294 -175 297
2011 117(1) 250(1) 291 -190 105 -445
1 : Data affected by changes in population controls.
Bureau of Labor Statistics Data