ReinyDays
Gold Member
We're not ignoring you ... we just disagree ... you can go through the statistical pathway as often as you like, but we're still going to say it's just a statistical pathway and doesn't explain the physics ...
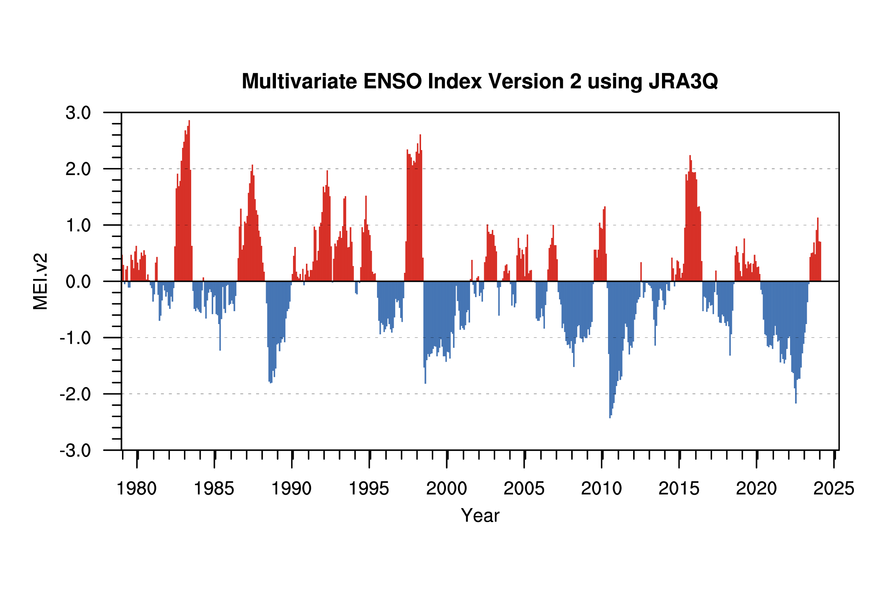
Why do you think millions of square miles of ocean surface temperatures can be accurately expressed as a single number? ...
Why do you think millions of square miles of ocean surface temperatures can be accurately expressed as a single number? ...