edthecynic
Censored for Cynicism
- Oct 20, 2008
- 43,044
- 6,883
- 1,830
Here we see again the CON$ervative redefining of words to control the language.Anomalies are the most accurate way of determining temperature trends, so it comes as no surprise that deniers deny anomalies.I'm just going to tell the both of you once more.. they post graphs of anomalies for one reason.. To draw confusion. Anomalies do not mean anything in terms of average climate over a short term like they show and point to... What difference does it make if point A had 10 temperatures over the year that were not in its expected norm? All it does is show variability in that point, and if you collect 100,000 points all you show is variability in those points. And across 10-60 years it means even less in terms of proof of climate change other than to show its changing all the damn time...
jesus people some of you should know better by now....
HOW?
An anomaly is a deviance from an expected norm... What is the expected norm and how is it derived? 30 years? 50? 100? What does an expected norm at a certain point and time derived from even 100 years tell us other than it got colder or warmer at that place at a comparable time in the last 100 years? And what does 100 years tell us in terms of climate other than that it varies over time?
You freaking sheep don't ask the obvious, you are too busy saying "yes of course you are the experts" to even realize what an anomaly is and its significance or rather insignificance to actual climate trends...
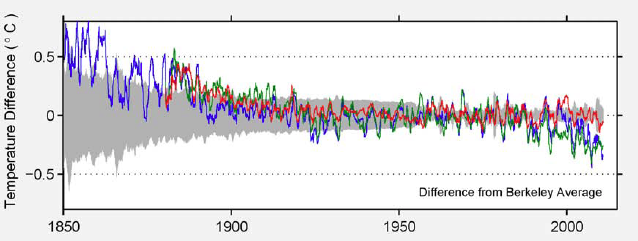
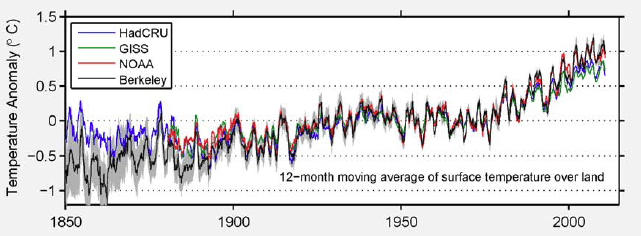
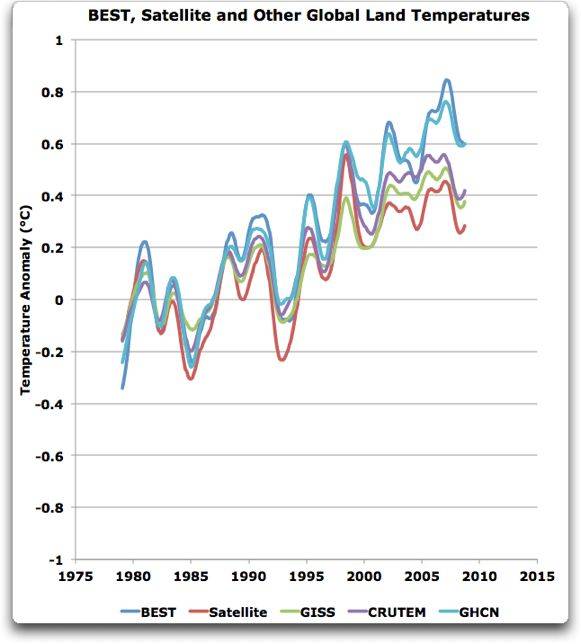
An anomaly is a deviation from a CALCULATED AVERAGE. As such it is the most accurate way to show a TREND.
October 11, 2011
RUSH: I've often said, I said last week he who controls the definition of words, the meaning of words, controls the debate. He who controls the language controls the debate.