Koch Brothers funded Climate Research. What they found? Oooh, that's gotta hurt.


Hey Einstein, please show me the post where edthecynic commented on Steve Milloy?
You are confused.

You said: "As far as skepticism for Milloy I have no reason to be skeptical of him, all he seems to have done is ask other people to be more critical and less alarmist."

REALLY??? Any intelligent, reasonable and HONEST person would not come to that conclusion from his op-ed piece in the Washington Times.

The following are ALL Steve Milloy's words:

MILLOY: Show us the bodies, EPA


Green agency uses phony death statistics to justify job-killing rules

To paraphrase cinematic sports agent Jerry McGuire, “Show me the bodies.”

While that may sound harsh, given that the EPA is about to kill hundreds of thousands of jobs and cost our crippled economy countless billions of dollars, Republicans must demand some sort of proof that the alleged harms are indeed happening.

The EPA says air pollution kills tens of thousands of people annually. This is on a par with traffic accident fatalities. While we can identify traffic accident victims, air pollution victims are unknown, unidentified and as far as anyone can tell, figments of EPA’s statistical imagination.


Steve Milloy is not only denying coal plant pollution kills people, he is denying AIR POLLUTION kills people...

You are dishonest, disingenuous and ignorant.

SO then please explain why you two have been answering each others post responses?

Bfgrn your first post here in this thread that I noticed was your snide little comment to edthecynic about me claiming something I didn't imply much less say... Remember? You also made a defense of milloy in your next post you told me for some strange reason how you were not ed and ed was not you.... I remembered thinking WTH? So I went with it since you opened the door... Must have a reason to just throw that out there like ya did...

Ed has been lying from the start, first about milloy, then muller and his partiality, then his business..

The only reason I call you two the same person is the fact YOU brought it up...LOL

Now please keep calling me confused SYBIL....:cuckoo:
In TYPICAL CON$ervative fashion, when caught lying, you just keep on lying!!! :asshole:

I never said anything about Milloy, you ignorant :asshole:
You were challenged to show where I said anything about Milloy, and all you do is repeat the lie, like a TYPICAL CON$ervative :asshole:
You have no credibility.

Hmm lets see... I start arguing with you and suddenly im not arguing with you anymore but rather Bfgrn, then when I am arguing Bfgrn I am suddenly arguing with you.. You two seriously need to figure out who is going to do the talking here... Whats more if you two don't like being mistaken for one another then work separating the characters a little more.. You both say pretty much the same things, the same way, and respond the same way every time you get caught lying.. Which happens to be pretty much every time you post..

its getting hard to tell you two apart now.. You were dumbass lying weasel #1 and he was dumbass lying weasel #2 .... Forgive any error I may have made regarding which douchebag you are. you are the Muller douchebag, and he is the milloy douchebag... My bad, now continue on with your crying..

:lol::lol::lol::lol::lol::lol:
 
SO then please explain why you two have been answering each others post responses?

Bfgrn your first post here in this thread that I noticed was your snide little comment to edthecynic about me claiming something I didn't imply much less say... Remember? You also made a defense of milloy in your next post you told me for some strange reason how you were not ed and ed was not you.... I remembered thinking WTH? So I went with it since you opened the door... Must have a reason to just throw that out there like ya did...

Ed has been lying from the start, first about milloy, then muller and his partiality, then his business..

The only reason I call you two the same person is the fact YOU brought it up...LOL

Now please keep calling me confused SYBIL....:cuckoo:
In TYPICAL CON$ervative fashion, when caught lying, you just keep on lying!!! :asshole:

I never said anything about Milloy, you ignorant :asshole:
You were challenged to show where I said anything about Milloy, and all you do is repeat the lie, like a TYPICAL CON$ervative :asshole:
You have no credibility.

Hmm lets see... I start arguing with you and suddenly im not arguing with you anymore but rather Bfgrn, then when I am arguing Bfgrn I am suddenly arguing with you.. You two seriously need to figure out who is going to do the talking here... Whats more if you two don't like being mistaken for one another then work separating the characters a little more.. You both say pretty much the same things, the same way, and respond the same way every time you get caught lying.. Which happens to be pretty much every time you post..

its getting hard to tell you two apart now.. You were dumbass lying weasel #1 and he was dumbass lying weasel #2 .... Forgive any error I may have made regarding which douchebag you are. you are the Muller douchebag, and he is the milloy douchebag... My bad, now continue on with your crying..

:lol::lol::lol::lol::lol::lol:

The only crying, lying and weaseling is coming from you. Maybe the reason edthecynic and I sound alike is because we are both intelligent, reasonable, logical and able to think like an adult.
 
In TYPICAL CON$ervative fashion, when caught lying, you just keep on lying!!! :asshole:

I never said anything about Milloy, you ignorant :asshole:
You were challenged to show where I said anything about Milloy, and all you do is repeat the lie, like a TYPICAL CON$ervative :asshole:
You have no credibility.

Hmm lets see... I start arguing with you and suddenly im not arguing with you anymore but rather Bfgrn, then when I am arguing Bfgrn I am suddenly arguing with you.. You two seriously need to figure out who is going to do the talking here... Whats more if you two don't like being mistaken for one another then work separating the characters a little more.. You both say pretty much the same things, the same way, and respond the same way every time you get caught lying.. Which happens to be pretty much every time you post..

its getting hard to tell you two apart now.. You were dumbass lying weasel #1 and he was dumbass lying weasel #2 .... Forgive any error I may have made regarding which douchebag you are. you are the Muller douchebag, and he is the milloy douchebag... My bad, now continue on with your crying..

:lol::lol::lol::lol::lol::lol:

The only crying, lying and weaseling is coming from you. Maybe the reason edthecynic and I sound alike is because we are both intelligent, reasonable, logical and able to think like an adult.

:lol::lol::lol::lol::lol::lol::lol::lol::lol::lol::lol::lol::lol::lol::lol::lol::lol:
 
Hmm lets see... I start arguing with you and suddenly im not arguing with you anymore but rather Bfgrn, then when I am arguing Bfgrn I am suddenly arguing with you.. You two seriously need to figure out who is going to do the talking here... Whats more if you two don't like being mistaken for one another then work separating the characters a little more.. You both say pretty much the same things, the same way, and respond the same way every time you get caught lying.. Which happens to be pretty much every time you post..

its getting hard to tell you two apart now.. You were dumbass lying weasel #1 and he was dumbass lying weasel #2 .... Forgive any error I may have made regarding which douchebag you are. you are the Muller douchebag, and he is the milloy douchebag... My bad, now continue on with your crying..

:lol::lol::lol::lol::lol::lol:

The only crying, lying and weaseling is coming from you. Maybe the reason edthecynic and I sound alike is because we are both intelligent, reasonable, logical and able to think like an adult.

:lol::lol::lol::lol::lol::lol::lol::lol::lol::lol::lol::lol::lol::lol::lol::lol::lol:

Thanks for proving my point, sonny...

Aww I'm sorry little fella, but you said all those things after being caught lying, whining, crying, and being a general punk.. I couldn't help BUT laugh...:lol::lol:

Now look you are playing adult...Aww thats so cute...So how old are you with this identity Sybil?

You do realize we can virtually take every post of both yours and eds and swap the names and no one would notice... Tell me that's not psychotic..:cuckoo:

you two wear matching sweater vests I bet...:lol:
 
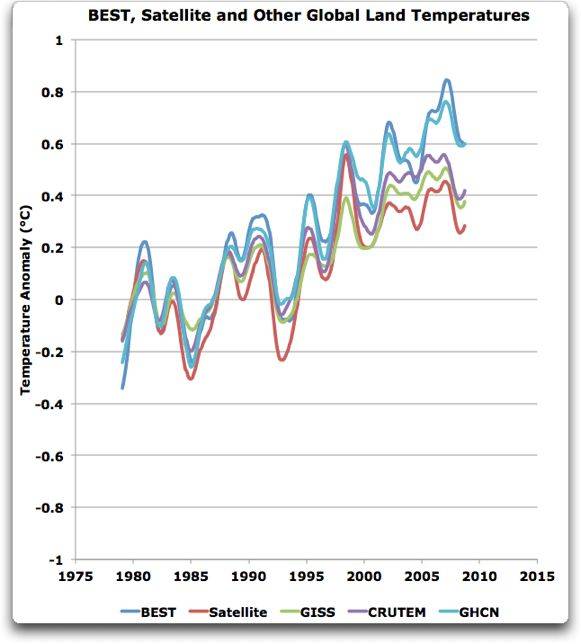
best-satellite-and-other-land-temperature.jpg


edthecynic said-
whatever the rationalization, a 5 year anomaly average is dishonest, and you know it!!!
the point of the graph is to compare the shapes of the various data sets from the beginning of the satellite era. to do that you have to set all of the lines to zero at the beginning. if you just take all of the lines at a specific date then you wouldnt get a good fit, therefore you take an average of the first five years and set that to zero, and as can be easily seen all of the graph lines match up well for the first decade and then start to depart from each other. no one cares what the absolute numbers are, the thing being studied here is how much difference there is at the end of the time period when all the lines started out equal.

the normalization period could have been 1, 3, 5, 10 years but Willis chose 5 years and as can be readily seen that does a good job of grouping all the temperature readings together at the beginning. we are looking at the anomalies not the actual numbers.
The purpose of the graph was to discredit BEST because it does not support the deniers' preconceived bias. That is the only reason a 5 year average is used for measuring anomalies. You never use less than 20 years as an average to measure an anomaly against, and there certainly was a lot more than 20 years worth of data. You can use 5 years for smoothing, but never for anomalies.

here is a part of a graph from BEST's figure #8 in the averaging paper.
BESTtempavgprocessfig8bfullsm-med.png

BEST is grey, NOAA is red, GISS is green and HadCru blue. unfortunately satellite data is not included but it is known to be lower than the other data sets. there is the same spread in the last 30 years with BEST being the warmest. is BEST just trying to discredit itself?

read the story about whether BEST seems to support the CO2 theory or the solar variation theory or neither at....
Explaining Muller vs. Muller: is BEST blissfully unaware of cosmic-ray-cloud theory? | Watts Up With That?
 
Same conclusion as presented before Congress.

http://www.berkeleyearth.org/Resourc...eley_Earth_UHI

Abstract
The effect of urban heating on estimates of global average land surface temperature is
studied by applying an urban-rural classification based on MODIS satellite data to the
Berkeley Earth temperature dataset compilation of 39,028 sites from 10 different publicly
available sources. We compare the distribution of linear temperature trends for these sites to
the distribution for a rural subset of 16,132 sites chosen to be distant from all MODISidentified
urban areas. While the trend distributions are broad, with one-third of the stations
in the US and worldwide having a negative trend, both distributions show significant
warming. Time series of the Earth’s average land temperature are estimated using the
Berkeley Earth methodology applied to the full dataset and the rural subset; the difference of
these shows a slight negative slope over the period 1950 to 2010, with a slope of -0.19°C ±
0.19 / 100yr (95% confidence), opposite in sign to that expected if the urban heat island
effect was adding anomalous warming to the record. The small size, and its negative sign,
supports the key conclusion of prior groups that urban warming does not unduly bias
estimates of recent global temperature change.
 
A for sure change of about 1/2 degree Celsius since 1950. Kind of shoots down you yappers about the data from the weather stations.

http://www.berkeleyearth.org/Resourc...raging_Process

Abstract
A new mathematical framework is presented for producing maps and large-scale
averages of temperature changes from weather station data for the purposes of climate analysis.
This allows one to include short and discontinuous temperature records, so that nearly all
temperature data can be used. The framework contains a weighting process that assesses the
quality and consistency of a spatial network of temperature stations as an integral part of the
averaging process. This permits data with varying levels of quality to be used without
compromising the accuracy of the resulting reconstructions. Lastly, the process presented here is
extensible to spatial networks of arbitrary density (or locally varying density) while maintaining
the expected spatial relationships. In this paper, this framework is applied to the Global
Historical Climatology Network land temperature dataset to present a new global land
temperature reconstruction from 1800 to present with error uncertainties that include many key
effects. In so doing, we find that the global land mean temperature has increased by 0.911 ±
0.042 C since the 1950s (95% confidence for statistical and spatial uncertainties). This change is
consistent with global land-surface warming results previously reported, but with reduced
uncertainty.
 
Same conclusion as presented before Congress.

http://www.berkeleyearth.org/Resourc...eley_Earth_UHI

Abstract
The effect of urban heating on estimates of global average land surface temperature is
studied by applying an urban-rural classification based on MODIS satellite data to the
Berkeley Earth temperature dataset compilation of 39,028 sites from 10 different publicly
available sources. We compare the distribution of linear temperature trends for these sites to
the distribution for a rural subset of 16,132 sites chosen to be distant from all MODISidentified
urban areas. While the trend distributions are broad, with one-third of the stations
in the US and worldwide having a negative trend, both distributions show significant
warming. Time series of the Earth’s average land temperature are estimated using the
Berkeley Earth methodology applied to the full dataset and the rural subset; the difference of
these shows a slight negative slope over the period 1950 to 2010, with a slope of -0.19°C ±
0.19 / 100yr (95% confidence), opposite in sign to that expected if the urban heat island
effect was adding anomalous warming to the record. The small size, and its negative sign,
supports the key conclusion of prior groups that urban warming does not unduly bias
estimates of recent global temperature change.
Oh, he has testified to Congress again? After his initial testimony reporting preliminary and incomplete results?
 

Thanks for proving my point, sonny...

Aww I'm sorry little fella, but you said all those things after being caught lying, whining, crying, and being a general punk.. I couldn't help BUT laugh...:lol::lol:

Now look you are playing adult...Aww thats so cute...So how old are you with this identity Sybil?

You do realize we can virtually take every post of both yours and eds and swap the names and no one would notice... Tell me that's not psychotic..:cuckoo:

you two wear matching sweater vests I bet...:lol:

Let's cut to the chase, OK.

You said: "As far as skepticism for Milloy I have no reason to be skeptical of him, all he seems to have done is ask other people to be more critical and less alarmist."

Here is what Milloy said in his op-ed piece in the Washington Times.

The following are ALL Steve Milloy's words:

MILLOY: Show us the bodies, EPA


Green agency uses phony death statistics to justify job-killing rules

To paraphrase cinematic sports agent Jerry McGuire, “Show me the bodies.”

While that may sound harsh, given that the EPA is about to kill hundreds of thousands of jobs and cost our crippled economy countless billions of dollars, Republicans must demand some sort of proof that the alleged harms are indeed happening.

The EPA says air pollution kills tens of thousands of people annually. This is on a par with traffic accident fatalities. While we can identify traffic accident victims, air pollution victims are unknown, unidentified and as far as anyone can tell, figments of EPA’s statistical imagination.


Now, please explain how you come up with Milloy is "asking people to be more critical and less alarmist"? Maybe I am reading it wrong, because it sure sounds like he is saying "air pollution victims are a figments of the EPA’s statistical imagination"
 
Last edited:
Thanks for proving my point, sonny...

Aww I'm sorry little fella, but you said all those things after being caught lying, whining, crying, and being a general punk.. I couldn't help BUT laugh...:lol::lol:

Now look you are playing adult...Aww thats so cute...So how old are you with this identity Sybil?

You do realize we can virtually take every post of both yours and eds and swap the names and no one would notice... Tell me that's not psychotic..:cuckoo:

you two wear matching sweater vests I bet...:lol:

Let's cut to the chase, OK.

You said: "As far as skepticism for Milloy I have no reason to be skeptical of him, all he seems to have done is ask other people to be more critical and less alarmist."

Here is what Milloy said in his op-ed piece in the Washington Times.

The following are ALL Steve Milloy's words:

MILLOY: Show us the bodies, EPA


Green agency uses phony death statistics to justify job-killing rules

To paraphrase cinematic sports agent Jerry McGuire, “Show me the bodies.”

While that may sound harsh, given that the EPA is about to kill hundreds of thousands of jobs and cost our crippled economy countless billions of dollars, Republicans must demand some sort of proof that the alleged harms are indeed happening.

The EPA says air pollution kills tens of thousands of people annually. This is on a par with traffic accident fatalities. While we can identify traffic accident victims, air pollution victims are unknown, unidentified and as far as anyone can tell, figments of EPA’s statistical imagination.


Now, please explain how you come up with Milloy is "asking people to be more critical and less alarmist"? Maybe I am reading it wrong, because it sure sounds like he is saying "air pollution victims are a figments of the EPA’s statistical imagination"

And so freaking what? Can you prove it? If you could than they could and they haven't. All they have done is shown possibilities.. When you or they can show a person dying as a direct result of modern air pollution, coming from modern systems with laws and rules already in place, please do so. I don't think a statistic that gives pollution as a possible factor is enough to enforce drastic regulation changes.

Now you want to cry because I am not outraged over common sense holding out over alarmism, go ahead...

BTW, why don't you ask to see the study and statistics the EPA is pushing? I would rather see that and make my own decision rather than listen anyones take on it. Frankly irresponsibly taking anybody, thing, agency, entity, or group at their word when they are going to reap the benefits of increased budgets, more money collected from regulation enforcement and fines, as well as the myriad of other ways this will be used to further that agency, is a really bad idea...

Show me this research, show me the statistics, show me the evidence and how it was established as such and then maybe I may have another opinion, but simply telling me they said so or he said this or that about it, is not going to make me change my mind about current regulations...

Hey edthecynic, just keep in mind that you are arguing with someone who doesn't believe even pollution is harmful to human, fish or foul.

And you like talking to yourself, as well as lie like a rug... The second is already proven here in this thread...Now care to address what I did say instead of what you want to believe?

So you admit I was not lying like a rug. You are.

Frankly irresponsibly taking anybody, thing, agency, entity, or group at their word when they are going to reap the benefits of increased budgets, more money collected from regulation enforcement and fines, as well as the myriad of other ways this will be used to further that agency, is a really bad idea...

Let's talk about the 'common sense' you mentioned. You say it is irresponsible to take the word of any 'body, thing, agency, entity, or group at their word when they are going to reap the benefits of increased budgets'.

What about taking the word of any 'body, thing, agency, entity, or group at their word when they are going to reap the benefits' of increased profits by NOT abating pollution?

Do you believe the corporations, dirty energy cartels and industries who pollute don't have a HUGE financial stake in defeating regulations and enforcement?

Now you want to cry because I am not outraged over common sense holding out over alarmism, go ahead...

Aren't YOU creating 'alarmism' over the EPA, scientific studies, medical evidence and known harm caused by pollution?

When you or they can show a person dying as a direct result of modern air pollution, coming from modern systems with laws and rules already in place, please do so.

How did those 'modern systems with laws and rules already in place' come about? Did the EPA have anything to do with it, or did the polluters decide to just not pollute and cut their profits?
 
Let's cut to the chase, OK.

You said: "As far as skepticism for Milloy I have no reason to be skeptical of him, all he seems to have done is ask other people to be more critical and less alarmist."

Here is what Milloy said in his op-ed piece in the Washington Times.

The following are ALL Steve Milloy's words:

MILLOY: Show us the bodies, EPA


Green agency uses phony death statistics to justify job-killing rules

To paraphrase cinematic sports agent Jerry McGuire, “Show me the bodies.”

While that may sound harsh, given that the EPA is about to kill hundreds of thousands of jobs and cost our crippled economy countless billions of dollars, Republicans must demand some sort of proof that the alleged harms are indeed happening.

The EPA says air pollution kills tens of thousands of people annually. This is on a par with traffic accident fatalities. While we can identify traffic accident victims, air pollution victims are unknown, unidentified and as far as anyone can tell, figments of EPA’s statistical imagination.


Now, please explain how you come up with Milloy is "asking people to be more critical and less alarmist"? Maybe I am reading it wrong, because it sure sounds like he is saying "air pollution victims are a figments of the EPA’s statistical imagination"

And so freaking what? Can you prove it? If you could than they could and they haven't. All they have done is shown possibilities.. When you or they can show a person dying as a direct result of modern air pollution, coming from modern systems with laws and rules already in place, please do so. I don't think a statistic that gives pollution as a possible factor is enough to enforce drastic regulation changes.

Now you want to cry because I am not outraged over common sense holding out over alarmism, go ahead...

BTW, why don't you ask to see the study and statistics the EPA is pushing? I would rather see that and make my own decision rather than listen anyones take on it. Frankly irresponsibly taking anybody, thing, agency, entity, or group at their word when they are going to reap the benefits of increased budgets, more money collected from regulation enforcement and fines, as well as the myriad of other ways this will be used to further that agency, is a really bad idea...

Show me this research, show me the statistics, show me the evidence and how it was established as such and then maybe I may have another opinion, but simply telling me they said so or he said this or that about it, is not going to make me change my mind about current regulations...


So you admit I was not lying like a rug. You are.


Let's talk about the 'common sense' you mentioned. You say it is irresponsible to take the word of any 'body, thing, agency, entity, or group at their word when they are going to reap the benefits of increased budgets'.

What about taking the word of any 'body, thing, agency, entity, or group at their word when they are going to reap the benefits' of increased profits by NOT abating pollution?

Do you believe the corporations, dirty energy cartels and industries who pollute don't have a HUGE financial stake in defeating regulations and enforcement?

Now you want to cry because I am not outraged over common sense holding out over alarmism, go ahead...

Aren't YOU creating 'alarmism' over the EPA, scientific studies, medical evidence and known harm caused by pollution?

When you or they can show a person dying as a direct result of modern air pollution, coming from modern systems with laws and rules already in place, please do so.

How did those 'modern systems with laws and rules already in place' come about? Did the EPA have anything to do with it, or did the polluters decide to just not pollute and cut their profits?

No you WERE lying and you still are.. Thats a separate argument.. You claimed he said some things which he clearly did not say at all. You lied.. Period..

Now as far as the rest of it, being cautious does not cost us anything but a bit of time and work. However jumping to quick decisions based on what the EPA tells us has and will cost us billions... You cannot prove anybody is dying due to modern emissions. Therefore legislation against deaths you cannot prove is just plain retarded.. As well as alarmist..

The EPA did their job once big deal, now they need to do their job everyday. Their job does not include hyperbole or baseless claims that they cannot prove to further their own agency.

Now quit posturing, you want us to support the EPA when they cannot prove a single death that resulted in a death caused directly by modern emissions. I say we should at least make sure there is a reason a damn good reason before making new laws, new regulations, and new budgets for the EPA..

Bfgrn your argument is silly.. You keep trying to argue separate points while avoiding the main ones... Can you produce these studies and statistics so we can look them over? Can you prove one single death directly caused by modern emissions? Can the EPA prove that modern emissions are killing people?

Yeah avoid the questions again...
 
Last edited:
best-satellite-and-other-land-temperature.jpg


edthecynic said [edthecynic did NOT say] IAN SAID-the point of the graph is to compare the shapes of the various data sets from the beginning of the satellite era. to do that you have to set all of the lines to zero at the beginning. if you just take all of the lines at a specific date then you wouldnt get a good fit, therefore you take an average of the first five years and set that to zero, and as can be easily seen all of the graph lines match up well for the first decade and then start to depart from each other. no one cares what the absolute numbers are, the thing being studied here is how much difference there is at the end of the time period when all the lines started out equal.

the normalization period could have been 1, 3, 5, 10 years but Willis chose 5 years and as can be readily seen that does a good job of grouping all the temperature readings together at the beginning. we are looking at the anomalies not the actual numbers.
The purpose of the graph was to discredit BEST because it does not support the deniers' preconceived bias. That is the only reason a 5 year average is used for measuring anomalies. You never use less than 20 years as an average to measure an anomaly against, and there certainly was a lot more than 20 years worth of data. You can use 5 years for smoothing, but never for anomalies.

here is a part of a graph from BEST's figure #8 in the averaging paper.
BESTtempavgprocessfig8bfullsm-med.png

BEST is grey, NOAA is red, GISS is green and HadCru blue. unfortunately satellite data is not included but it is known to be lower than the other data sets. there is the same spread in the last 30 years with BEST being the warmest. is BEST just trying to discredit itself?

read the story about whether BEST seems to support the CO2 theory or the solar variation theory or neither at....
Explaining Muller vs. Muller: is BEST blissfully unaware of cosmic-ray-cloud theory? | Watts Up With That?
Gee, what a surprise, Anthony Watts' dishonest site again.

Weren't there two graphs in figure 8?
Why yes, yes there were. Why did YOU choose to post only one?

From the Watts site:
Wow, compared to the evidence provided by the other temperature records, BEST’s full sample really favors the CO2 theory over this critical period. Thus on the only part of the temperature record that is probative, BEST displays two strongly contradictory graphs without a word of commentary.
Well, let's see how many words of non-commentary there were in the BEST report.

http://berkeleyearth.org/Resources/Berkeley_Earth_Averaging_Process
In Figure 8, we compare our land reconstruction to the land reconstructions published by
the three other groups (results updated online, methods described by Brohan et al. 2006; Smith et
al. 2008; Hansen et al. 2010). Overall our global land average is similar to those obtained by
these prior efforts. There is some disagreement amongst the three groups, and our result is most
similar overall to NOAA’s work. The differences apparent in Figure 8 may partially reflect
difference in source data, but they probably primarily reflect differences in methodology.

The GHCN dataset used in the current analysis overlaps strongly with the data used by
other groups. The GHCN was developed by NOAA and is the sole source of the land-based
weather station data in their temperature reconstructions (but does not include the ocean data also
used in their global temperature analyses). In addition, GISS uses GHCN as the source for ~85%
of the time series in their analysis. The remaining 15% of GISS stations are almost exclusively
US and Antarctic sites that they have added / updated, and hence would be expected to have
somewhat limited impact due to their limited geographic coverage. HadCRU maintains a separate data set from GHCN for their climate analysis work though approximately 60% of the
GHCN stations also appear in HadCRU.

BESTtempavgprocessfig8fullsm-med.png
BESTtempavgprocessfig8bfullsm-med.png


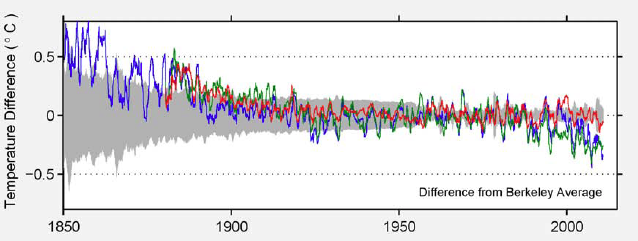
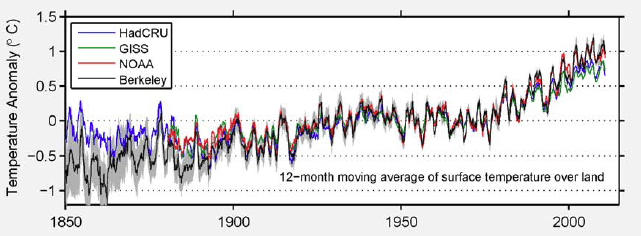
Figure 8. Comparison of the Berkeley Average to existing land-only averages reported by the
three major temperature groups. The upper panel shows 12-month moving averages for the four
reconstructions, and a gray band corresponding to the 95% uncertainty range on the Berkeley
average. The lower panel shows each of the prior averages minus the Berkeley average, as well
as the Berkeley average uncertainty. As noted in the text, there is a much larger disagreement
among the existing groups when considering land-only data than when comparing the global
averages. HadCRU and GISS have systematically lower trends than Berkeley and NOAA. In
part, this is likely to reflect differences in how “land-only” has been defined by the three groups.

Berkeley is very similar to the NOAA result during the twentieth century and slightly lower than
all three groups during the 19th century.

The GISS and HadCRU work produce lower land-average temperature trends for the late
part of the 20th century. In this regard, our analysis suggests a degree of global land-surface
warming during the anthropogenic era that is consistent with prior work (e.g. NOAA) but on the
high end of the existing range of reconstructions. We note that the difference in land average
trends amongst the prior groups has not generally been discussed in the literature. In part, the
spread in existing land-only records may have received little attention because the three groups
have greater agreement when considering global averages that include oceans (Figure 1). We
strongly suspect that some of the difference in land-only averages is an artifact of the different
approaches to defining “land-only” temperature analyses. Our analysis and that produced by
NOAA explicitly construct an average that only considers temperature values over land.


However, that is not the only possible approach. The literature suggests that the GISS “land-
only” data product may be generated by measuring the “global” temperature fields using only
data reported over land. In this scenario temperature records in coastal regions and on islands
would be extrapolated over the oceans to create a “global” field using only land data. Whether or
not this approach was actually used is unclear from the literature, but it would result in an
overweighting of coastal and oceanic stations. This would in turn lead to a reduction in the
calculated “land” trend in a way that is qualitatively consistent with the difference observed in
Figure 8.

Though we are similar to NOAA for most of the 20th century, we note that we have
somewhat lower average temperatures during the period 1880-1930. This gives us a slightly
larger overall trend for the 20th century than any of the three groups. Most of that difference
comes from the more uncertain early period. In previous work, it has been argued that
instrumentation changes may have led to an artificial warm bias in the early 1900s (Folland et al.
2001, Parker 1994). To the degree that our reconstruction from that era is systematically lower
than prior work (Figure 8), it could be that our methods are more resistant to biases due to those
instrumental changes.
BTW, the graph you posted is a graph of the DEVIATION of NOAA, GISS and HadCru data in the top graph of anomalies from the BEST data in the top graph of anomalies, not a second contradictory graph of anomaly data as you and the author Rawls seem to think!
 
Last edited:
both graphs show the same spread in temperature, about 0.3C. it is just easier to see the difference when the deviation is graphed rather than the actual temp anomalies. or if you artificially set all the graphs to the same absolute temp at a specific point (normalization) and then watch the different data sets diverge with time as was done at WUWT with the extra UAH data set added. all three graphs show the same divergence but it is easiest to pick out the divergence from the background in the deviations graph.

do you disbelieve that there has been a divergence?

what is the reason for divergence?

which data set has the better result?

what theories are supported by the results?

personally I think the bloom is off the CO2 rose and the information from all sorts of areas is showing that CO2 is insufficent to explain what is going on. we shall see.

we also shall see whether BEST gets through peer review without major changes. it is a difficult task to prepare a new system of processing that much data without making some missteps along the way.
 
Wow, compared to the evidence provided by the other temperature records, BEST’s full sample really favors the CO2 theory over this critical period. Thus on the only part of the temperature record that is probative, BEST displays two strongly contradictory graphs without a word of commentary.
both graphs show the same spread in temperature, about 0.3C. it is just easier to see the difference when the deviation is graphed rather than the actual temp anomalies. or if you artificially set all the graphs to the same absolute temp at a specific point (normalization) and then watch the different data sets diverge with time as was done at WUWT with the extra UAH data set added. all three graphs show the same divergence but it is easiest to pick out the divergence from the background in the deviations graph.

do you disbelieve that there has been a divergence?

what is the reason for divergence?

which data set has the better result?

what theories are supported by the results?

personally I think the bloom is off the CO2 rose and the information from all sorts of areas is showing that CO2 is insufficent to explain what is going on. we shall see.

we also shall see whether BEST gets through peer review without major changes. it is a difficult task to prepare a new system of processing that much data without making some missteps along the way.
They do not show the same temp spread!!! Now you pretend not to be able to read the scale of a graph! You just can't admit that you and the author made fools of yourselves thinking both parts of figure 8 were contradictory graphs of anomalies!!!

I disbelieve you know what your are talking about.

The reason for your ignorance is CON$ would rather play dumb than admit the truth.

CON$ would get better results if they would just admit the truth.

Deniers' theories are NOT supported by the results.

Personally I think the bloom is off the denier's rose and the information from all sorts of areas is showing that natural causes is insufficient to explain what is going on. We shall see.
 
Last edited:
I'm just going to tell the both of you once more.. they post graphs of anomalies for one reason.. To draw confusion. Anomalies do not mean anything in terms of average climate over a short term like they show and point to... What difference does it make if point A had 10 temperatures over the year that were not in its expected norm? All it does is show variability in that point, and if you collect 100,000 points all you show is variability in those points. And across 10-60 years it means even less in terms of proof of climate change other than to show its changing all the damn time...

jesus people some of you should know better by now....
Anomalies are the most accurate way of determining temperature trends, so it comes as no surprise that deniers deny anomalies. :cuckoo:

HOW?

An anomaly is a deviance from an expected norm... What is the expected norm and how is it derived? 30 years? 50? 100? What does an expected norm at a certain point and time derived from even 100 years tell us other than it got colder or warmer at that place at a comparable time in the last 100 years? And what does 100 years tell us in terms of climate other than that it varies over time?

You freaking sheep don't ask the obvious, you are too busy saying "yes of course you are the experts" to even realize what an anomaly is and its significance or rather insignificance to actual climate trends...:lol:
 

Forum List

Back
Top