Kiritimati Atoll: The Largest Coral Atoll In The World Lost 80 Percent Of Its Coral To Bleaching in

So, Westie, you believe the people who are looking at the wind turbine photographs I posted to be so stupid that they simply do not realize what they're looking at?

What you SHOULD be showing them is the very UNUSEFUL sketchy production graphs. Here for most all of Australia. And the ONLY monthly graphs they will publish are for their 3 BEST months of the year. And not many of those.

Wind Energy in Australia | February 2017 | Aneroid
 
Last edited:
At the bottom of the checkboxes for that plot --- UNCHECK everything on the last line except NSW1 -- THAT'S where the largest Australia wind farms are. The results are pretty embarrassing for their BEST OF charts..

Or uncheck everything at the bottom row except VIC1. To see how little was available there sparsely..
 
I haven't noticed the ocean getting warmer

heat_content700m2000myr.png


heat_content55-07.png


https://www.nodc.noaa.gov/OC5/3M_HEAT_CONTENT/heat_content55-07.png

The oceans are taking in most of the heat.

That is the whole ocean, not the LOCAL areas where the Corals actually grow.

Meanwhile I am still waiting for warmists to acknowledge that early in the Holocene, the Ocean waters were a LOT warmer than they are now, yet Corals thrived anyway. Also how did they survive the massive meltwater pulses that lasted for centuries at the early days of this interglacial period when Sea Level leaped upwards at a rapid pace.................

Waiting.... waiting......................................
And I am still waiting for dumb fucks like you to realize there is a vast difference between a rapid change, and one that occurs at a much slower rate. The slower rate gives the organisms time to adjust.

Really you have no answer for their surviving MELTWATER Pulses early in the Holocene, how did they survive that?

fig1_s.jpg


Here you see both RAPID and slower rate right there in the chart, since they survived the NATURAL rapid sea level rise, they surely can survive the much slower rise we see today.

Once again you don't think beyond your nose.
 
From Watts Up With That?

May 29, 2018

David Middelton

Excerpt:

The Great Barrier Reef has had five near-death experiences in the past 30,000 years

By Katie LanginMay. 28, 2018 , 11:00 AM
Thirteen thousand years ago, as the last ice age ended, entire stretches of Australia’s Great Barrier Reef perished. Rising sea levels blanketed the world’s largest collection of corals with sediment coming off the newly inundated land, blocking the sunlight corals need to grow. The reef eventually recovered, but it took hundreds to thousands of years. This near death and eventual resurrection wasn’t a one-off, according to a new study that reveals the reef’s shifting boundaries over geological time. It’s a tale that has played out five times over the past 30,000 years—and it may be happening again today.
The study “holds some really important lessons” for understanding how resilient corals are in the face of change, and how quickly they recover after catastrophic events, says Kim Cobb, a paleoclimatologist at the Georgia Institute of Technology in Atlanta, who wasn’t involved in the work. Today’s rate of sea level rise is moderate—about 10% of the rate 13,000 years ago—but going forward it may accelerate dramatically, she says.
[…]
The reef migrated up and down during that time, the team found, closely tracking changes in sea level at a rate of up to 20 vertical meters per thousand years.
[…]
Scientists have long wondered where the Great Barrier Reef went during the last ice age, says Jody Webster, a marine geologist at The University of Sydney in Australia and the lead author of the study. “We were able to find it.”
But the reef couldn’t always keep up with changing sea levels. The researchers identified five times when it appeared to die off—twice during the cool down of the last ice age, when falling sea levels exposed corals to air; and three times 10,000 to 17,000 years ago, when glacial melt caused sea levels to rise rapidly. “We haven’t drilled or sampled everything,” says Webster, so he and his colleagues can’t confirm how extensive the die-off was. But they think corals persisted in some places along the continental shelf during those times, allowing reefs in other locations to re-establish within 2000 years.
[…]
The historical die-offs are similar to “what we’re seeing right now on the Great Barrier Reef,” says Mark Eakin, a coral reef ecologist at the National Oceanic and Atmospheric Administration in College Park, Maryland, who wasn’t involved in the study.
[…]
The new research is “yet another reminder” that what we’re doing to the ocean is going to have dramatic consequences, Eakin says. “Don’t expect reefs to be able to bounce back quickly.”
Science (as in: She blinded me with)

LINK

Worth the reading as he is Geologist and posted a lot of Coral history in charts, showing they have for MILLIONS of years been able to handle changes far more rapid and deeper in scale that what they put up with today.
 
I haven't noticed the ocean getting warmer

heat_content700m2000myr.png


heat_content55-07.png


https://www.nodc.noaa.gov/OC5/3M_HEAT_CONTENT/heat_content55-07.png

The oceans are taking in most of the heat.
You do realize this is just 0.002 deg C, over 70 years, don't you?


No, I don't

figure-14.png


Good math Billy. Why don't you show us your work.
Considering that graph was made by exaggerating Joules in the ocean using a model and the fact there has been NO OBSERVED rise in mechanical recording devices...

Its safe to say your graph is Bull Shit...
 
First, I want to see your source that states no rise has been seen in "mechanical recording devices".

Then...

I think it's time that the deniers assumption that all they have to do is mention the word "models" and their arguments are won, needs come to a screeching halt. The modeling done here are calculations extrapolating from a finite temperature set to an estimate of the average temperature of the global ocean. As the amount of data available increases, the results these four different groups arrive at get closer and closer.

And, since any projection requires modeling, deniers seem to think that predictive science has no value. Obviously, that is because they do not like the results at which every projection arrives: increasing global temperatures and all that go with it.

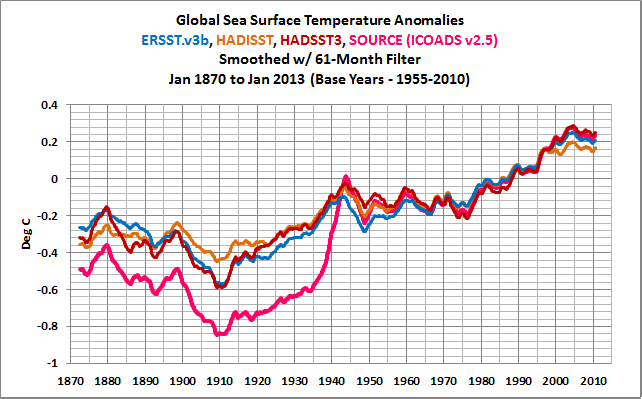
sea-surface-temp-figure1-2016.png

This graph shows how the average surface temperature of the world’s oceans has changed since 1880. This graph uses the 1971 to 2000 average as a baseline for depicting change. Choosing a different baseline period would not change the shape of the data over time. The shaded band shows the range of uncertainty in the data, based on the number of measurements collected and the precision of the methods used.

Data source: NOAA, 20166
Web update: August 2016

6. NOAA (National Oceanic and Atmospheric Administration). 2016. Extended reconstructed sea surface temperature (ERSST.v4). National Centers for Environmental Information. Accessed March 2016. www.ncdc.noaa.gov/data-access/marineocean-data/extended-reconstructed-sea-surface-temperature-ersst.

Extended Reconstructed Sea Surface Temperature (ERSST)

The Extended Reconstructed Sea Surface Temperature (ERSST) dataset is a global monthly sea surface temperature analysis derived from the International Comprehensive Ocean–Atmosphere Dataset with missing data filled in by statistical methods. This monthly analysis begins in January 1854 continuing to the present and includes anomalies computed with respect to a 1971–2000 monthly climatology.

Extended Reconstructed Sea Surface Temperature (ERSST) v5
  • The newest version of ERSST is version v5. Major improvements in v5 include: 1) Inclusion and use of new sources and new versions of input datasets, such as data from Argo floats (new source), ICOADS R3.0 (from R2.5), HadISST2 (from HadISST1) sea ice concentration, and 2) Improved methodologies, such as inclusion of additional statistical modes, less spatial-temporal smoothing, better quality control method, and bias correction with baseline to modern buoy observations. The new version improves the spatial structures and magnitudes of El Nino and La Nina events.
Extended Reconstructed Sea Surface Temperature (ERSST) v4
  • The ERSST version v4 is produced on a 2° × 2° grid with spatial completeness enhanced using statistical methods. Version 4, is based on optimally tuned parameters using the latest datasets and improved analysis methods.
Extended Reconstructed Sea Surface Temperature (ERSST) v3b
  • The ERSST version 3b is optimally tuned to exclude under-sampled regions for global averages. In contrast to version 3, ERSST v3b does not include satellite data, which were found to cause a cold bias significant enough to change the rankings of months.


So, what measurements did they collect Billy Boy?
 
Last edited:
figure%201.png

Ocean temperature analysis and heat content estimate from Institute of Atmospheric Physics | NCAR - Climate Data Guide

figure%202.png


These data include those from the ARGO floats Billy. Last time I checked, they would qualify as recording devices.


I love how they quite simply tell everyone how they falsify their data to conform to what they want. The highlighted section tells the tale of data fraud.

"The primary input data are bias-corrected (for depth error, temperature error and probe type) XBT measurements from the World Ocean Database. Model simulations were used to guide the mapping from point measurements to the grid, while sampling error was estimated by sub-sampling the ARGO data at the locations of the earlier observations. The dataset has been used to estimate ocean heat content change since 1940, which compares favorably with the top-of-atmosphere radiative imbalance since 1985.
The RAW data shows just a +0.002 deg change... Only after much massaging does a rise outside the MOE of the recording devices become visible.

I have always wanted to know how they determined and adjusted for thermoline changes...?
 
SOURCE?

And perhaps you meant "thermocline"
 
Last edited:
Covalent?

ther·mo·cline
ˈTHərmōˌklīn/
noun
  1. a steep temperature gradient in a body of water such as a lake, marked by a layer above and below which the water is at different temperatures.
co·va·lent
ˌkōˈvālənt/
adjective
CHEMISTRY
  1. relating to or denoting chemical bonds formed by the sharing of electrons between atoms.
"Covailent"

something about force fields that repel photons before they can hit matter warmer than the matter that emitted the photons.
 
Billy Bob, still waiting for a source for your claim that ocean temperatures have only risen 0.002(F? C?) (over what time period?)
 
Kiritimati Atoll: The Largest Coral Atoll In The World Lost 80 Percent Of Its Coral To Bleaching in the Last Ten Months
Their estimate is, as of early April, about 80 percent of the coral colonies at Kiritimati are now dead, and another 15 percent are severely bleached and likely to die. It’s as if someone decided to cut down 90 percent of the Redwood Forest. Overnight, an entire ecosystem has essentially blinked out of existence.

I spoke with the team by satellite phone on one of their last days of dives, and the shock in their voices was palpable.

“There’s a good chance that this reef will never be the same,” said Cobb. “It’s a wake-up call.”

From cores that Cobb’s team has analyzed, she estimated there’s been nothing like the current die-off in Kiritimati in the 7,000 years of ancient coral history there. About 10 months ago, this reef was still mostly healthy, as it has been for thousands of years. Global warming will make the pressure on global corals even worse in the coming decades, and many of the world’s reefs can expect future bleaching events to occur more frequently. For some, like those in Kiritimati, the last few months — the worst global coral bleaching episode in history — may be a point of no return.
The Largest Coral Atoll In The World Lost 80 Percent Of Its Coral To Bleaching

This is really sad...
Another reason for the GOP to cheer!
 

Forum List

Back
Top