
Old Rocks
Diamond Member
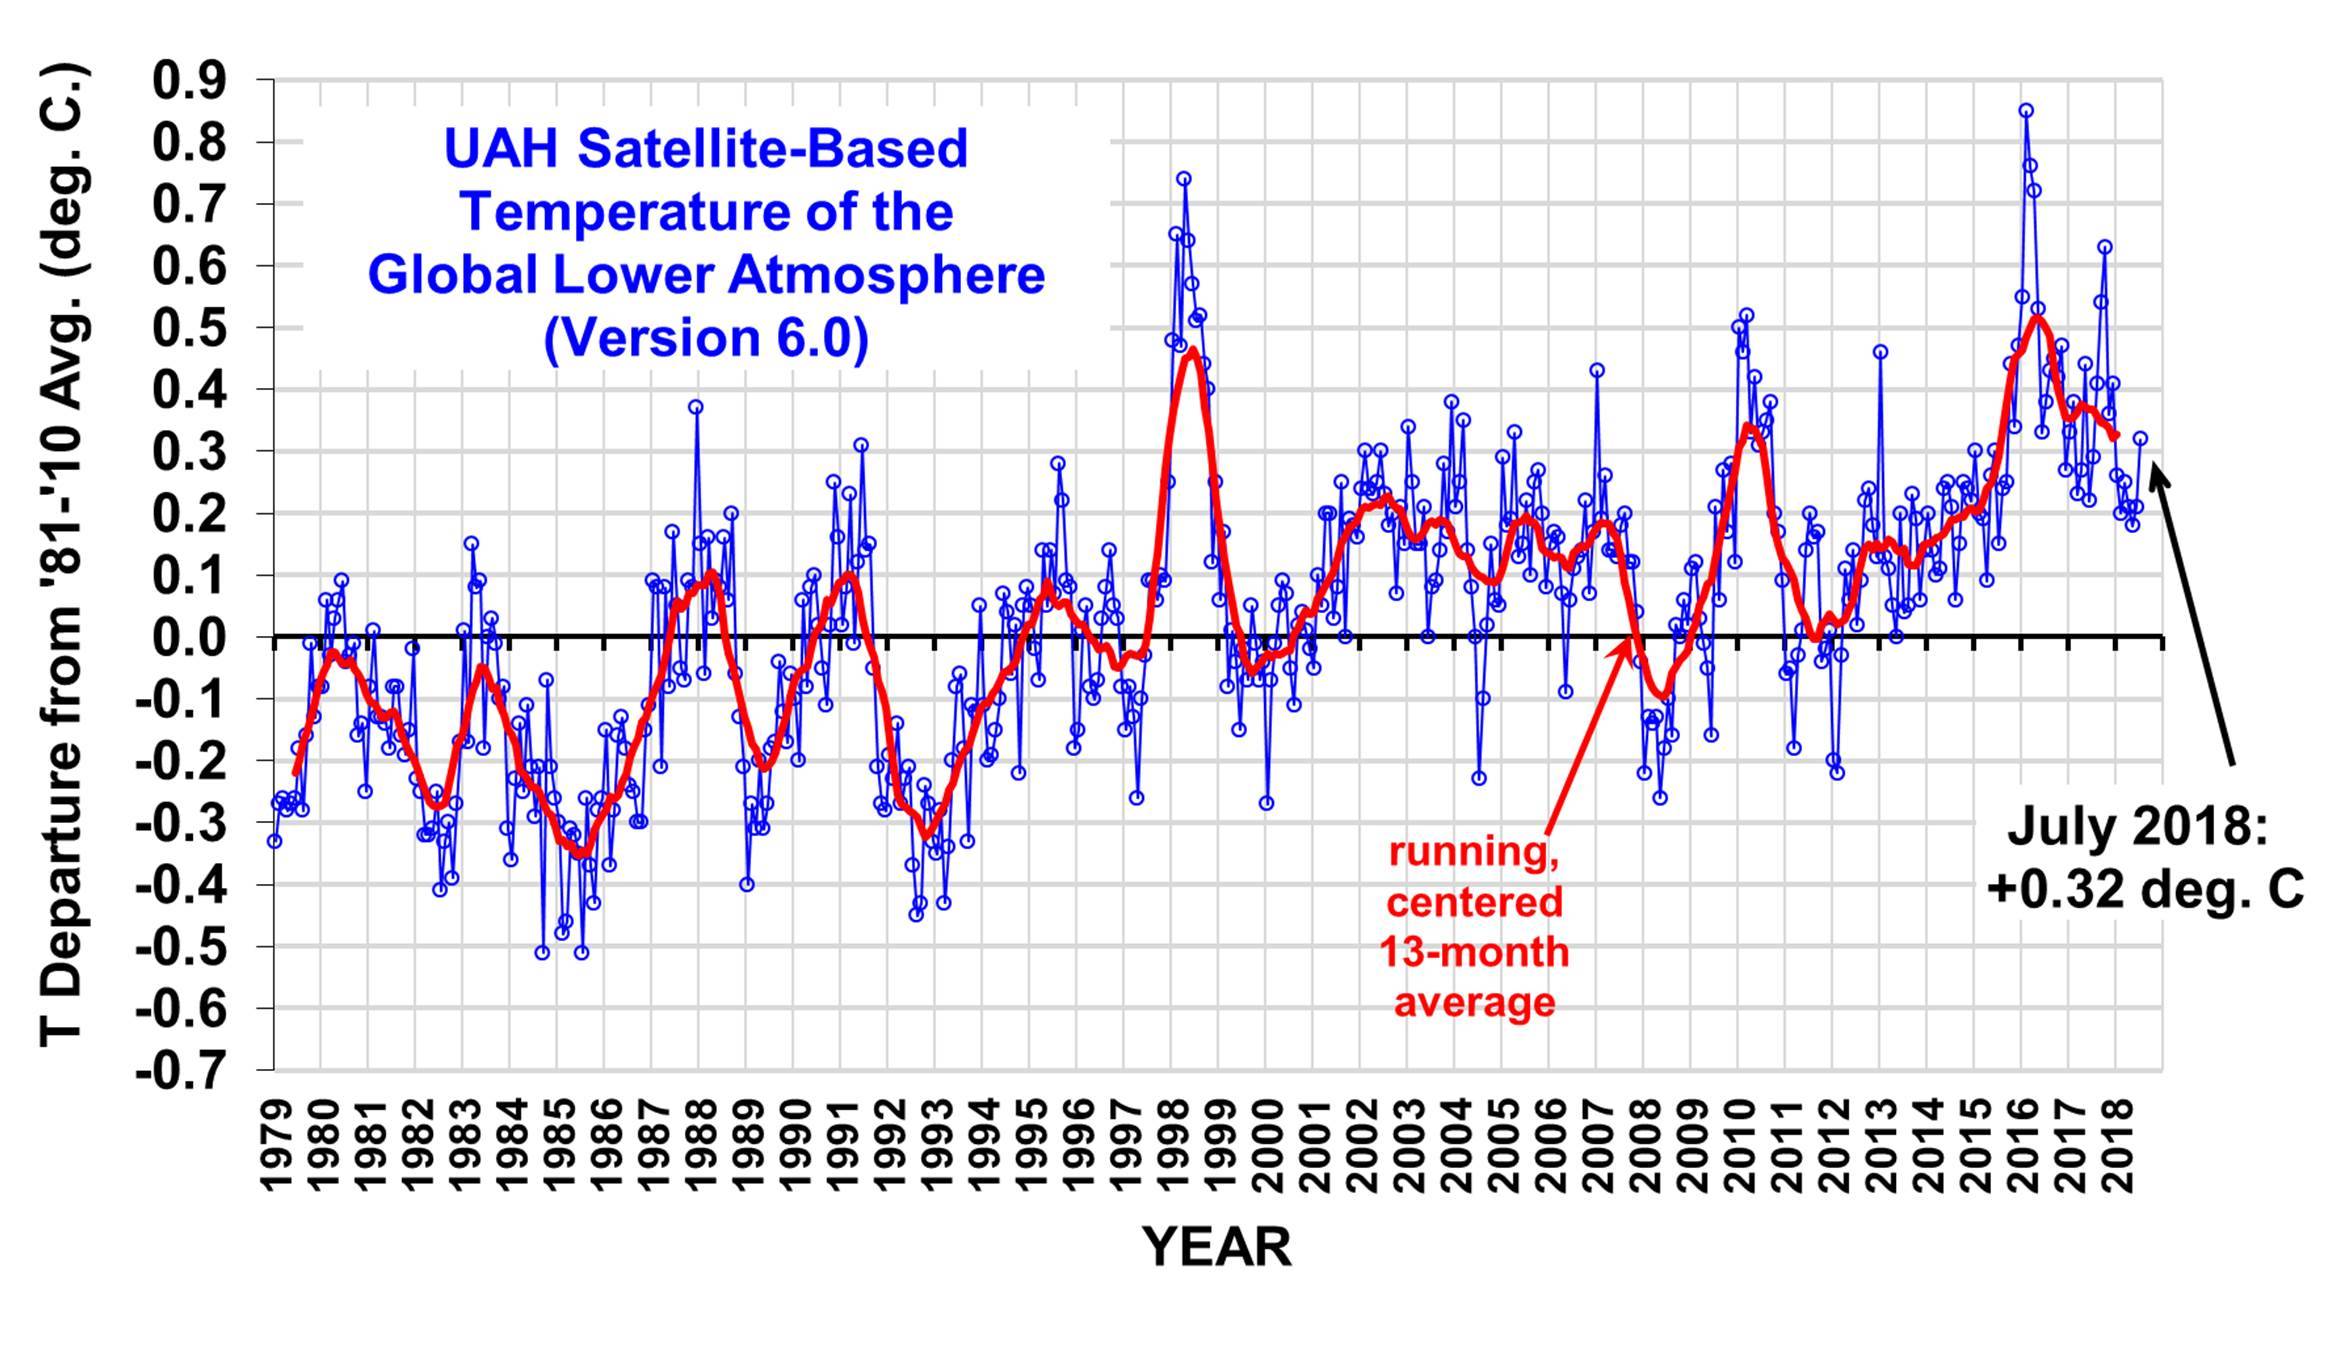
We just finished a La Nina, and the lowest we saw was 0.19. Now we are in a neutral Enso, and have hit 0.32 already. Prior to 1997, there was only one month warmer that that. And we are headed into an El Nino, so most of the months for the rest of this year are going to have an even higher anomaly.


