from
Chart of the Day : Rolling Stone : National Affairs Daily
haven't been able to find it on the site
Follow along with the video below to see how to install our site as a web app on your home screen.

Note: This feature currently requires accessing the site using the built-in Safari browser.
from
Chart of the Day : Rolling Stone : National Affairs Daily
haven't been able to find it on the site
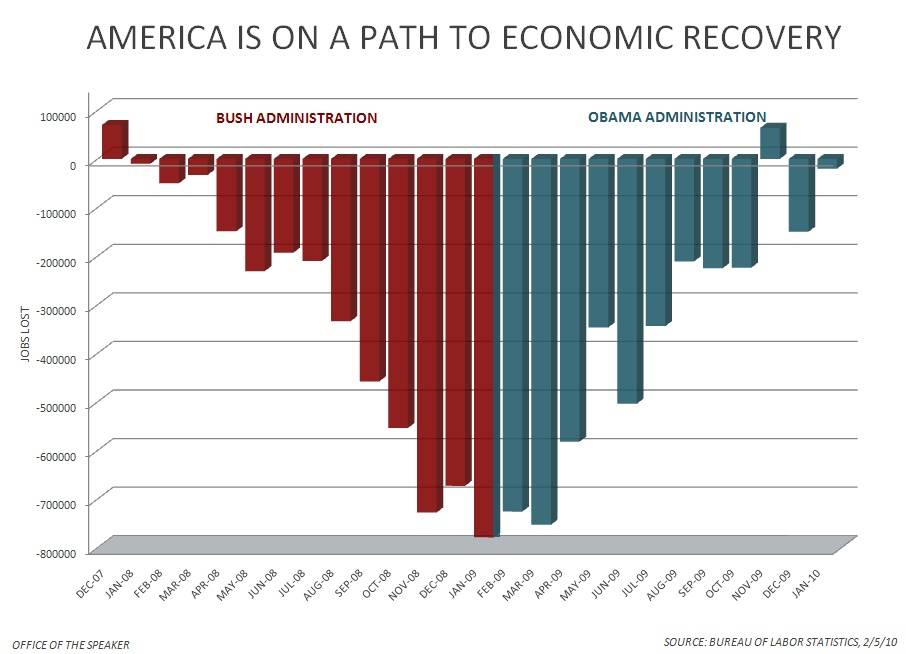
What the heck is it a chart of?
from
Chart of the Day : Rolling Stone : National Affairs Daily
haven't been able to find it on the site
It is accurate. USA Today shows it every week.
Is this a bogus chart?
Is this a bogus chart?
It's probably accurate, but since Congress controls spending it's of no value to put "Bush" and "Obama" on the chart.
Yup.If there is a recovery it will be Bushs recovery.Is this a bogus chart?
It's probably accurate, but since Congress controls spending it's of no value to put "Bush" and "Obama" on the chart.
It should read "Bush" and "Bush" considering Obama is still blaming Bush...

What the heck is it a chart of?

Heres another chart.

As close a graph as I could find at the bureau of labor statistics site:
Notice: Data not available: U.S. Bureau of Labor Statistics
No graph labeled America on path to economic recovery.
As close a graph as I could find at the bureau of labor statistics site:
Notice: Data not available: U.S. Bureau of Labor Statistics
No graph labeled America on path to economic recovery.
The numbers are from BLS. The graph was made by Rolling Stone.
