Sunsettommy
Diamond Member
- Mar 19, 2018
- 14,884
- 12,518
- 2,400
Note the fakery s0ns......post above.
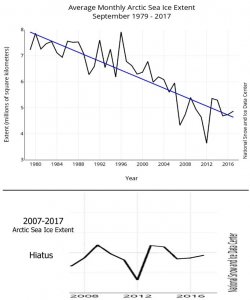
"trending down"
"Heat"
"dropping"
Semantic gheyness used by every climate crusader nutter these days in every post....purposefully so. Terms that never answer the question, "As compared to what?"
"Trending down" conveys doom....until you take a gander at the previous #'s. Statistical fakery with loose terms is ghey.
I can take my Mustang to the track and return and tell everybody, "I was alot faster!". But I only pick up 2 tenths and trapped at 116. Fake.....but "faster" sure sounds impressive! The dim fail to ask the question, "What did you run last time out?"
Progressives pull these faggy stunts all the time.
He is profoundly dishonest since it has stopped declining and currently higher than in August 23 2003.
Arctic summer sea ice now growing 12 years
Our Japanese skeptic blogger and good friend Kirye reports using the data from the Danish Meteorological Institute (DMI) that peak summer Arctic sea ice volume upward growth trend has been extended yet another year – now 12 years.
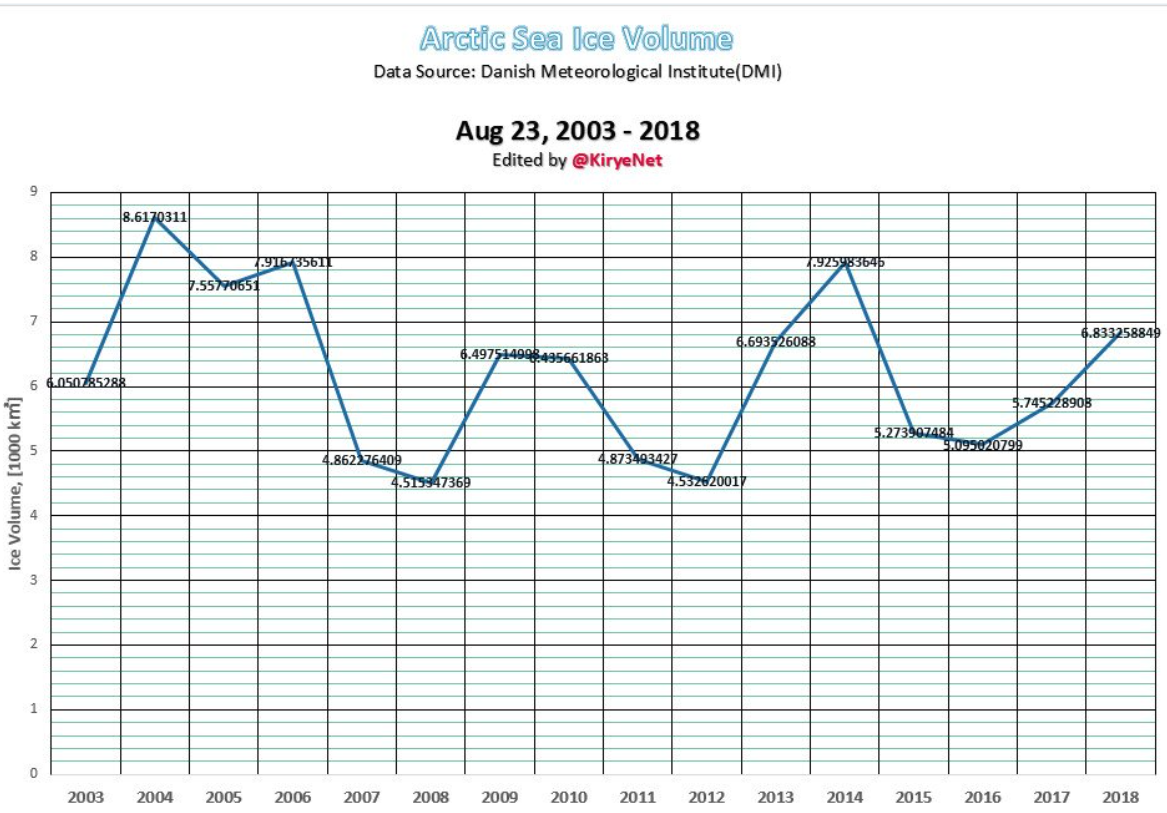
Chart by Kirye. Data source: Danish Meteorology Institute (DMI).