How Much Revenue will Government Gain from Tax the Rich?

Your link had this sub link, "However, recently released statistics from the Internal Revenue Service" which is where I found that amount in column 54.

Thanks. I clicked that before but did not realize all the info scrolling to the right.

It is an eye opener. Looking at the change in "Tax as a percentage of AGI" from 2001 to 2007 the largest percentage drop is in the highest income earners. They did recover some in 2008 & 2009. I guess the Rich really did get a bigger percent tax break.


Which means we need to overhaul our tax code or go to a flat tax with no deductions, loopholes, or credits. Or at least put a ceiling on deductions and clamp down on the req'ts for tax exempt foundations.
That part gets my vote!!!!
 
Of, of course, stats like that are intended for suckers. Most of the wealth of incomes over $500,000 does not show up as AGI, which does not include unrealized capital gains. What I found interesting was that 3% of the over $500,000 group had NO TAXABLE INCOME!!!!!

Where did you find this info?
Your link had this sub link, "However, recently released statistics from the Internal Revenue Service" which is where I found that amount in column 54.

From that source it only shows that 0.5% over $500,000 had no taxable income. You probably added all the 0.5% income categories together but forgot to divide by the number of income categories.

It also shows people with No adjusted gross income paying $10,594 to $18,744.
 
Last edited:
Where did you find this info?
Your link had this sub link, "However, recently released statistics from the Internal Revenue Service" which is where I found that amount in column 54.

From that source it only shows that 0.5% over $500,000 had no taxable income. You probably added all the 0.5% income categories together but forgot to divide by the number of income categories.

It also shows people with No adjusted gross income paying $10,594 to $18,744.
You are misreading the chart. Column A shows the range of income for each category, so you must add ALL the categories from $500,000 on up together to get the total % of people earning over $500,000 who show no taxable income.

That is not correct. If they had 200 income categories above $500,000 it would total 100% show no taxable income. Clearly you must average the income brackets & not add them.
 
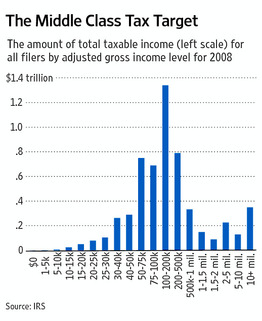
I posted this just the other day

ED-AN418_1taxes_D_20110417172403.jpg


willie sutton robbed banks because thats where the money is, well, the middle class is where the money is. Period.
 
From that source it only shows that 0.5% over $500,000 had no taxable income. You probably added all the 0.5% income categories together but forgot to divide by the number of income categories.

It also shows people with No adjusted gross income paying $10,594 to $18,744.
You are misreading the chart. Column A shows the range of income for each category, so you must add ALL the categories from $500,000 on up together to get the total % of people earning over $500,000 who show no taxable income.

That is not correct. If they had 200 income categories above $500,000 it would total 100% show no taxable income. Clearly you must average the income brackets & not add them.
Not in you want the correct TOTAL!!!!!!!!!
 
I posted this just the other day

ED-AN418_1taxes_D_20110417172403.jpg


willie sutton robbed banks because thats where the money is, well, the middle class is where the money is. Period.
Again you show your ignorance of where the wealth truly exists. The real wealth exists in capital assets which do not show up on a taxable income chart. Capital assets are NOT taxable until they are sold, and if Lyin' Ryan gets his way, they will never be taxed even after being sold!!!!!!!
 
Last edited:
I posted this just the other day

ED-AN418_1taxes_D_20110417172403.jpg


willie sutton robbed banks because thats where the money is, well, the middle class is where the money is. Period.

True, a glance at the graph gives the impression that the middle class pays everything, what with the bell shaped curve bold faced class warfare title. However a closer look at the numbers shows that most taxable income is from AGI's over $200k, and that's the highest of the top 5% of filers. So even these data hand picked from somewhere in the IRS show that us rich are paying the bills around here.

Your welcome.
 
You are misreading the chart. Column A shows the range of income for each category, so you must add ALL the categories from $500,000 on up together to get the total % of people earning over $500,000 who show no taxable income.

That is not correct. If they had 200 income categories above $500,000 it would total 100% show no taxable income. Clearly you must average the income brackets & not add them.
Not in you want the correct TOTAL!!!!!!!!!

I am sorry the education has failed you. Inventing facts does not help anyones argument.
 

Link to what? The Bush tax cuts? Is this a joke? You didn't know that Bush cut taxes to the tune of 2.4 trillion and more than 52% went to the top 1%? This is what everyone has been arguing about since Bush's first term.


Joke's on you dude, get your facts straight before you jump on somebody else. The below is from cnn.money.com:


" Treasury estimates the costs of making the tax cuts permanent for everyone is $3.7 trillion over 10 years.

Of that, $3 trillion accounts for the cost of extending them for the vast majority of Americans, as the president has proposed. The remaining $700 billion is the cost of extending them permanently for the high-income earners. "

Link?
 
That is not correct. If they had 200 income categories above $500,000 it would total 100% show no taxable income. Clearly you must average the income brackets & not add them.
Not in you want the correct TOTAL!!!!!!!!!

I am sorry the education has failed you. Inventing facts does not help anyones argument.
In typical CON$ervative fashion, when completely wrong stoop to condescension.

To get the TOTAL over $500,000 you ADD all the income levels in the column from $500,000 on up, just as the original article did to get the $1+ trillion TOTAL of all the income of earners over $500,000.
 

Forum List

Back
Top