ScienceRocks
Democrat all the way!
- Banned
- #1
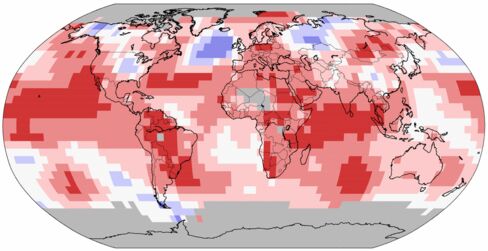
March 2015 Blended Land and Sea Surface
Temperature Anomalies in degrees Celsius

March 2015 Blended Land and Sea Surface
Temperature Percentiles
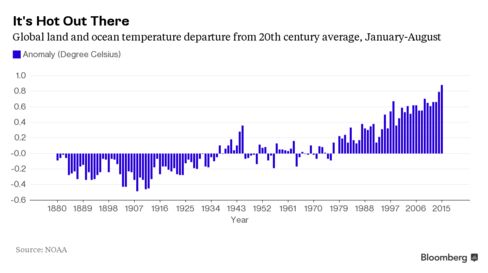
The average temperature across global land and ocean surface temperatures combined for March 2015 was 0.85°C (1.53°F) higher than the 20th century average of 12.7°C (54.9°F). This marks the highest March temperature in the 136-year period of record, surpassing the previous record of 2010 by 0.05°C (0.09°F). The Northern Hemisphere had its second highest March temperature on record, behind only 2008, while the Southern hemisphere tied with 2002 for third highest.
The March 2015 global temperature was the third highest monthly departure from average on record for any month, just 0.01°C (0.02°F) lower than the monthly anomalies for February 1998 and January 2007. This also replaces February 2015 (+0.84°C / +1.51°F) as the third highest departure from average among all months, moving that month to fourth highest. Seven of the past eleven months (May, June, August, September, October, and December 2014, along with March 2015) have tied or set new record high monthly temperatures.
Global Analysis - March 2015 State of the Climate National Climatic Data Center NCDCThe first quarter of 2015 was the warmest such period on record across the world's land and ocean surfaces, at 0.82°C (1.48°F) above the 20th century average, surpassing the previous record of 2002 by 0.05°C (0.09°F). The average global land surface temperature was also record high for the January–March period, at 1.59°C (2.86°F). Most of Europe, Asia, South America, eastern Africa, and western North America were much warmer than average, as shown by the Temperature Percentiles map above, with record warmth particularly notable in the western United States and eastern Siberia along the Verkhoyansk Range.
.85c for March based on the noaa. Only slightly above the .84c by the giss. Most importantly the year Jan-March period is at .82c...El nino is exploding into the picture and if this keeps up we could jump over .7c and go straight to .8c for the year!


")