Hottest June on record and the hottest 6 months on record..Noaa!

ScienceRocks

Democrat all the way!
Mar 16, 2010
59,455
6,793
1,900
The Good insane United states of America
Hottest June on record and the hottest 6 months on record..Noaa!
Global Analysis - June 2015 National Centers for Environmental Information NCEI
The combined average temperature over global land and ocean surfaces for June 2015 was the highest for June in the 136-year period of record, at 0.88°C (1.58°F) above the 20th century average of 15.5°C (59.9°F), surpassing the previous record set just one year ago by 0.12°C (0.22°F). This was also the fourth highest monthly departure from average for any month on record. The two highest monthly departures from average occurred earlier this year in February and March, both at 0.90°C (1.62°F) above the 20th century average for their respective months, while January 2007 had the third highest, at 0.89°C (1.60°F) above its monthly average.

June 2015 also marks the fourth month this year that has broken its monthly temperature record, along with February, March, and May. The other months of 2015 were not far behind: January was second warmest for its respective month and April was third warmest. These six warm months combined with the previous six months (four of which were also record warm) to make the period July 2014–June 2015 the warmest 12-month period in the 136-year period of record, surpassing the previous record set just last month (June 2014–May 2015). As shown in the table below, the 10 warmest 12-month periods have all been marked in the past 10 months.

The first six months of 2015 comprised the warmest such period on record across the world's land and ocean surfaces, at 0.85°C (1.53°F) above the 20th century average, surpassing the previous record set in 2010 by 0.09°C (0.16°F). It should be noted that 2010 was the last year with El Niño conditions; however El Niño had ended by this point in 2010, while it appears to be continuing to mature at the same point in 2015.
The average global sea surface temperature of +0.65°C (+1.17°F) for the year-to-date was the highest for January–June in the 136-year period of record, surpassing the previous record of 2010 by 0.04°C (0.07°F). The average land surface temperature of +1.40°C (2.52°F) was also record high, surpassing the previous record of 2007 by 0.13°C (0.23°F).

Pretty fucking Amazing I'd say.
 
Now is not the time to talk about it. The time of course is in the dead of winter when hopefully a polar vortex is hammering the East Coast...........So all the cons can say, "Were's that Globull warmin now, huh"??????
 
th51185c.gif
 
I don't think a lot of people will argue that the weather changes. Nor will they argue that CO2 fluctuates. Do you have any idea of the amount of CO2 that is dissolved in the oceans and locked in the permafrost? BFD.

The intricacies of weather, global, solar systemic, and how our path through the galaxy affects our cosmic cycles of weather are poorly understood. We are small, very small creatures in a very big system.

Our weather is more than just global. It is more than just solar. It is galactic. We do not have the power to affect the galaxy. You will never convince me that we do have the power to affect the galaxy. Sorry.
 
The relative change of our position in the galaxy, throughout the entire history of human civilization, is absolutely trivial. At the Solar System's position, the rotation period of the Milky Way is 240 million years. Thus, in the 12,000 years of human civilization, we have rotated less than two one-hundredths of a single degree. Since the beginning of the Industrial Revolution, we have rotated slightly more than three one-hundred-thousandths of a degree. The galaxy is not causing changes in our climate.
 
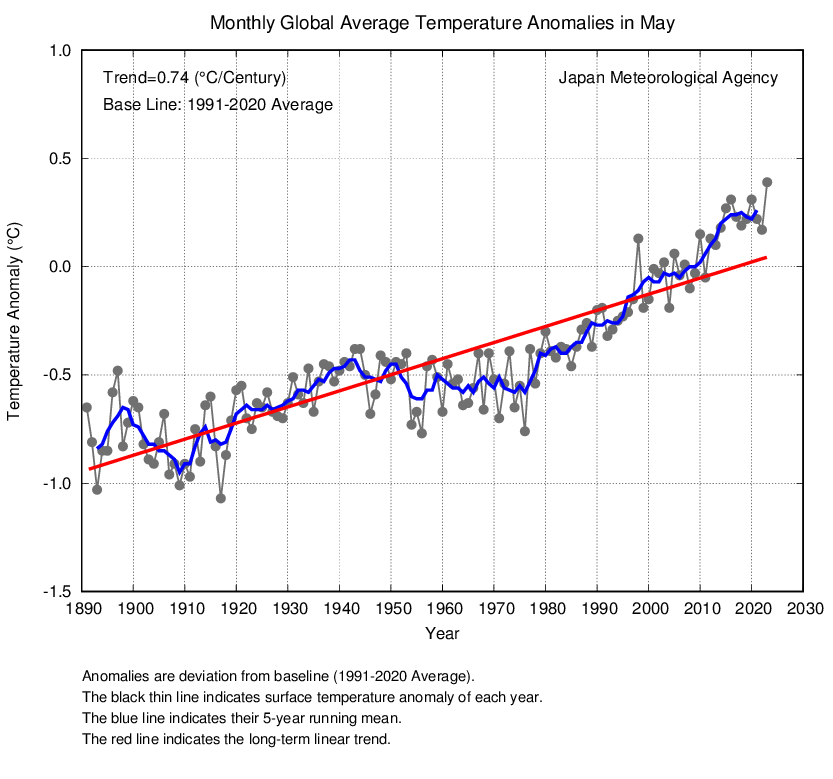
Global Average Surface Temperature Anomalies

The monthly anomaly of the global average surface temperature in May 2015 (i.e. the average of the near-surface air temperature over land and the SST) was +0.38°C above the 1981-2010 average (+0.75°C above the 20th century average), and was the warmest since 1891. On a longer time scale, global average surface temperatures have risen at a rate of about 0.70°C per century.

may_wld.png

Japan Meteorological Agency
 
The relative change of our position in the galaxy, throughout the entire history of human civilization, is absolutely trivial. At the Solar System's position, the rotation period of the Milky Way is 240 million years. Thus, in the 12,000 years of human civilization, we have rotated less than two one-hundredths of a single degree. Since the beginning of the Industrial Revolution, we have rotated slightly more than three one-hundred-thousandths of a degree. The galaxy is not causing changes in our climate.

Yep. You are absolutely correct. But the salient fact here is NOT humans, it is the EARTH silly.

It’s worth taking a quick detour to talk about how long it takes the Solar System to move around the center of the galaxy. According to National Geographic, that’s about 225 million years. Dinosaurs were starting to arise the last time we were in the position we are today.

It IS very important. Stop being so obtuse. Different places in the galaxy have different physical laws.

I suppose you actually believe that the speed of light, the coefficient of gravity, and all those other "constants" in physics that they taught you in high school and college were the same no matter where you are at, eh? If you believe that, then I don't suppose there's much we need to discuss, your mind is controlled. You can't see the whole forest here.

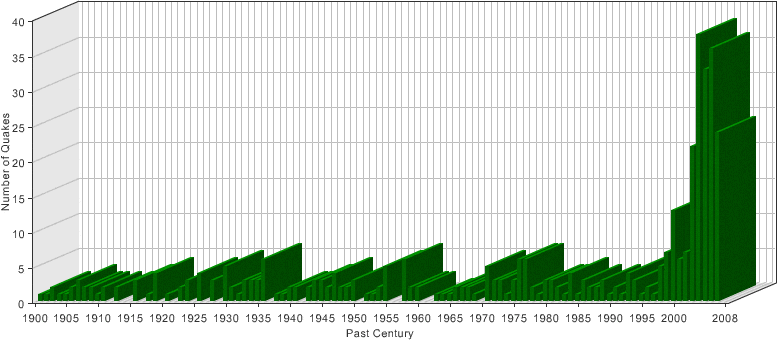
If humans were causing this problem, then how are we causing the increase in the number of high magnitude quakes? Is that caused by our increased use of hydro-carbon fuel too? If so, please explain that causation fallacy to me as well.

quakegraph.gif

USGS Worldwide Deadly Destructive Earthquakes Between Magnitudes 6 and 8 Since 1900
 
Hottest June on record and the hottest 6 months on record..Noaa!
Global Analysis - June 2015 National Centers for Environmental Information NCEI
The combined average temperature over global land and ocean surfaces for June 2015 was the highest for June in the 136-year period of record, at 0.88°C (1.58°F) above the 20th century average of 15.5°C (59.9°F), surpassing the previous record set just one year ago by 0.12°C (0.22°F). This was also the fourth highest monthly departure from average for any month on record. The two highest monthly departures from average occurred earlier this year in February and March, both at 0.90°C (1.62°F) above the 20th century average for their respective months, while January 2007 had the third highest, at 0.89°C (1.60°F) above its monthly average.

June 2015 also marks the fourth month this year that has broken its monthly temperature record, along with February, March, and May. The other months of 2015 were not far behind: January was second warmest for its respective month and April was third warmest. These six warm months combined with the previous six months (four of which were also record warm) to make the period July 2014–June 2015 the warmest 12-month period in the 136-year period of record, surpassing the previous record set just last month (June 2014–May 2015). As shown in the table below, the 10 warmest 12-month periods have all been marked in the past 10 months.

The first six months of 2015 comprised the warmest such period on record across the world's land and ocean surfaces, at 0.85°C (1.53°F) above the 20th century average, surpassing the previous record set in 2010 by 0.09°C (0.16°F). It should be noted that 2010 was the last year with El Niño conditions; however El Niño had ended by this point in 2010, while it appears to be continuing to mature at the same point in 2015.
The average global sea surface temperature of +0.65°C (+1.17°F) for the year-to-date was the highest for January–June in the 136-year period of record, surpassing the previous record of 2010 by 0.04°C (0.07°F). The average land surface temperature of +1.40°C (2.52°F) was also record high, surpassing the previous record of 2007 by 0.13°C (0.23°F).

Pretty fucking Amazing I'd say.
I don't know dude. You all can continue to post up these bullshit charts that are admittedly manipulated, but you will not get one of us on the skeptics side to ever give it credence. So post it up there month after month, but know we all know it is manufactured and not temperatures. Remember that.
 
The relative change of our position in the galaxy, throughout the entire history of human civilization, is absolutely trivial. At the Solar System's position, the rotation period of the Milky Way is 240 million years. Thus, in the 12,000 years of human civilization, we have rotated less than two one-hundredths of a single degree. Since the beginning of the Industrial Revolution, we have rotated slightly more than three one-hundred-thousandths of a degree. The galaxy is not causing changes in our climate.
And yet you can't produce one piece of evidence to show what 10 PPM of CO2 does to temperatures. NOT ONE!
 
In the 1860s, physicist John Tyndall recognized the Earth's natural greenhouse effect and suggested that slight changes in the atmospheric composition could bring about climatic variations. In 1896, a seminal paper by Swedish scientist Svante Arrhenius first speculated that changes in the levels of carbon dioxide in the atmosphere could substantially alter the surface temperature through the greenhouse effect.
 
So fucking what?

I don't really give a damn about what some non-credible source says about an insignificant surface air temperature record.

Global warming nutters are stupid.
 

Forum List

Back
Top