RyzinEnagy
Member
- Aug 4, 2006
- 103
- 5
- 6
The question you should be asking is the theory wrong. So far the prime theorists have been proven to manipulate data to further their financial and political aims. This is fact.
To obfuscate the fact that NONE of their predictions have come true (Hansens well publicised prediction of temp rise was 300% off and that even after the CO2 level rose MUCH HIGHER than he predicted).
Now let's look at what the climatologists actually do shall we? They are responsible for generating computer models to predict the future climate. That is their science. The test of their theory will quite obviously be to test their computer models against actual recorded weather. So far they can not recreate weather that occured ten days ago. They can't recreate weather that occured 10 years ago, in short their theories fail every time they are tested.
So to try and push policy they present predictions that will hopefully so frighten the civilians that the people will allow onerous laws to be passed to take their wealth away from them and give it to others (like the AGW "scientists and their cronies in government)
so we end up with predictions for everything.
Here is some homework for you. Type a year into google followed by weather. ANY year.
You will be amazed by all the "weather events", as defined by the AGW alarmists, that occure every single year.
Our point is when you predict everything is related to global warming then eventually you will get one correct. That doesn't make your theory right however!
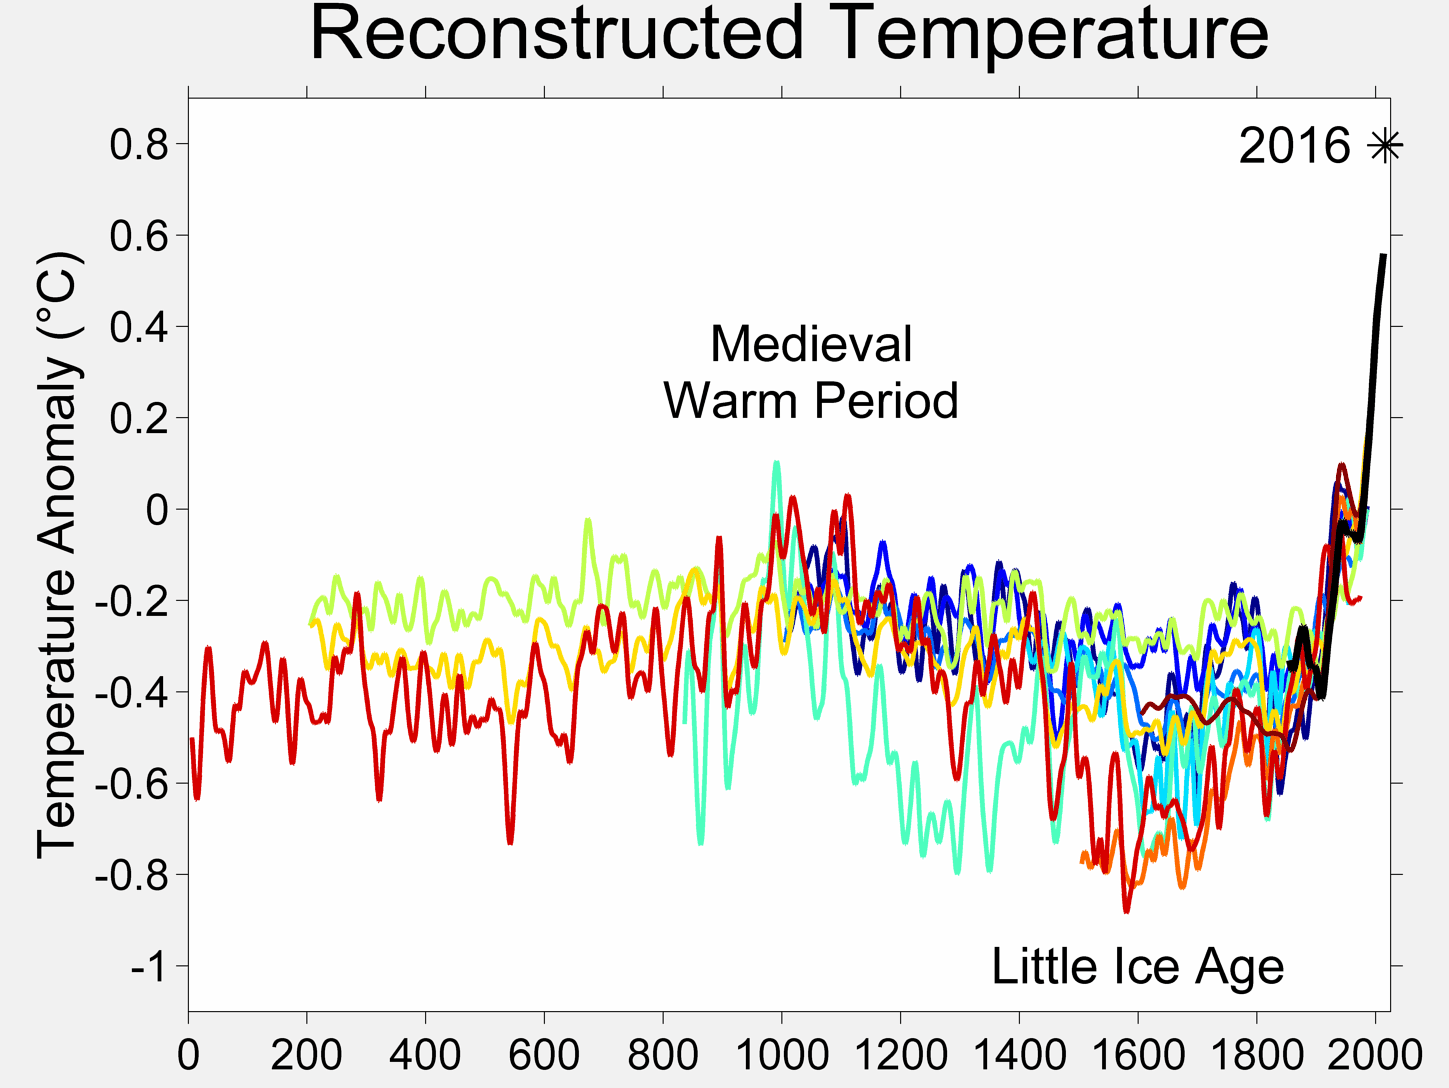
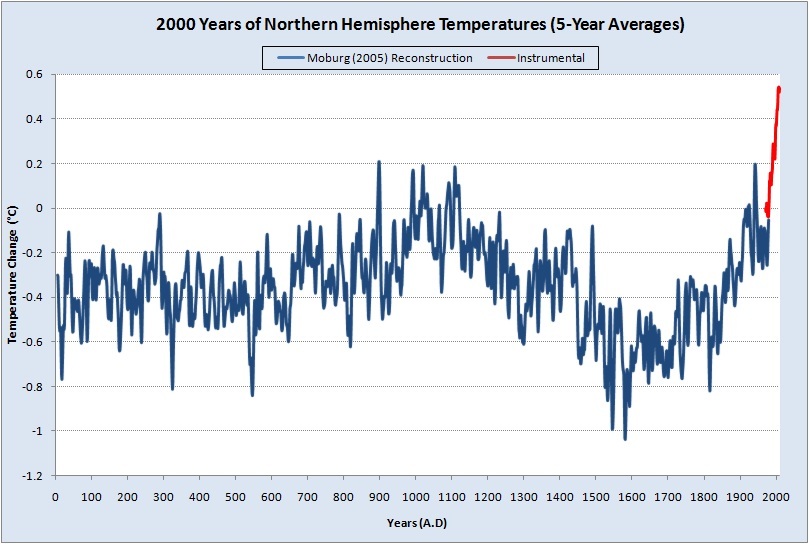
What's important is the trend. Do the trends show that weather events are getting more extreme? I don't know myself because current data is spotty, but to laugh at the prediction of this thing happening without posting proof of him being incorrect is awful.
Also, the "hide the decline" thing was taken out of context. Aside from that, that some predictions haven't happened as predicted is not proof that AGW isn't happening. I'll elaborate on the other stuff you said when I get back from class tonight.