Here's an interesting study..

westwall

WHEN GUNS ARE BANNED ONLY THE RICH WILL HAVE GUNS
Gold Supporting Member
Apr 21, 2010
96,532
57,630
2,605
Nevada
They took great pains to use data from uncorrupted Stations. An interesting read.


Abstract
Temperature data 1900–2010 from meteorological stations across the world have been analyzed and it has been found that all land areas generally have two different valid temperature trends. Coastal stations and hill stations facing ocean winds are normally more warm-trended than the valley stations that are sheltered from dominant oceans winds.

Thus, we found that in any area with variation in the topography, we can divide the stations into the more warm trended ocean air-affected stations, and the more cold-trended ocean air-sheltered stations. We find that the distinction between ocean air-affected and ocean air-sheltered stations can be used to identify the influence of the oceans on land surface. We can then use this knowledge as a tool to better study climate variability on the land surface without the moderating effects of the ocean.

We find a lack of warming in the ocean air sheltered temperature data – with less impact of ocean temperature trends – after 1950. The lack of warming in the ocean air sheltered temperature trends after 1950 should be considered when evaluating the climatic effects of changes in the Earth’s atmospheric trace amounts of greenhouse gasses as well as variations in solar conditions.


http://journals.sagepub.com/doi/full/10.1177/0958305X18756670
 
What I really want to know is the list of weather stations in 1900..it is real hard to find and figure out.
 
It was my understanding that it was ocean temperatures that were being measured.

And also that receding glaciers were also being noted.
 
They took great pains to use data from uncorrupted Stations. An interesting read.


Abstract
Temperature data 1900–2010 from meteorological stations across the world have been analyzed and it has been found that all land areas generally have two different valid temperature trends. Coastal stations and hill stations facing ocean winds are normally more warm-trended than the valley stations that are sheltered from dominant oceans winds.

Thus, we found that in any area with variation in the topography, we can divide the stations into the more warm trended ocean air-affected stations, and the more cold-trended ocean air-sheltered stations. We find that the distinction between ocean air-affected and ocean air-sheltered stations can be used to identify the influence of the oceans on land surface. We can then use this knowledge as a tool to better study climate variability on the land surface without the moderating effects of the ocean.

We find a lack of warming in the ocean air sheltered temperature data – with less impact of ocean temperature trends – after 1950. The lack of warming in the ocean air sheltered temperature trends after 1950 should be considered when evaluating the climatic effects of changes in the Earth’s atmospheric trace amounts of greenhouse gasses as well as variations in solar conditions.


http://journals.sagepub.com/doi/full/10.1177/0958305X18756670
Interesting distinction...

Atmosphere containing water vapor is warmer than drier atmosphere that is down welling. Now why would that be?
/sarc

This paper clearly gives the water cycle control of the system. This will not bode well with alarmists.. It clearly shows empirical evidence of convection and conduction energy losses..

" The lack of warming in the ocean air sheltered temperature trends after 1950 should be considered when evaluating the climatic effects of changes in the Earth’s atmospheric trace amounts of greenhouse gasses as well as variations in solar conditions."

{bolding mine}

"lack of warming in sheltered regions" indicates CO2 is not retaining heat, only water vapor is.... That one's gonna hurt!
 
This ought to give the alarmists some heart burn...

Well sited and protected from ocean wind locations show NO WARMING.... (Note bottom graphs blue line- very little variance for over 100 years)

upload_2018-5-4_21-33-1.png
 
I just realized there are no hockey sticks in any of those graphing's..

I know of a lot of papers that have ZERO hockey sticks in them, they cover regions of the planet. Many show little to no warming in them.

Warmists in this forum show strong allergic reactions to published papers I post, it seems they can't handle it.
 
Oceans cover 70% of the world.

From the link,

"We find that the distinction between ocean air-affected and ocean air-sheltered stations can be used to identify the influence of the oceans on land surface."

Think about it.
 
I just realized there are no hockey sticks in any of those graphing's..

I know of a lot of papers that have ZERO hockey sticks in them, they cover regions of the planet. Many show little to no warming in them.

Warmists in this forum show strong allergic reactions to published papers I post, it seems they can't handle it.

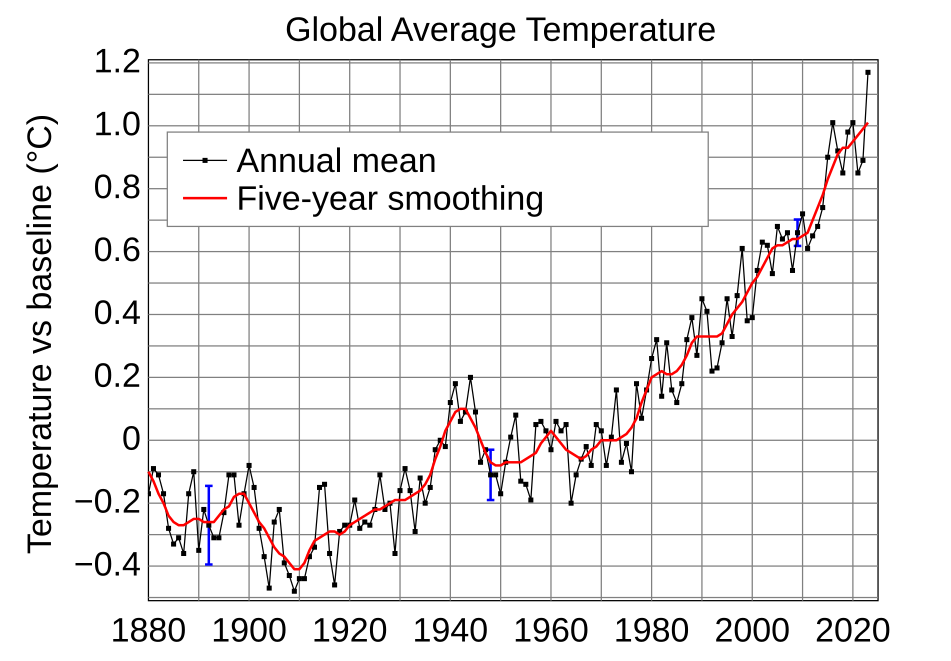
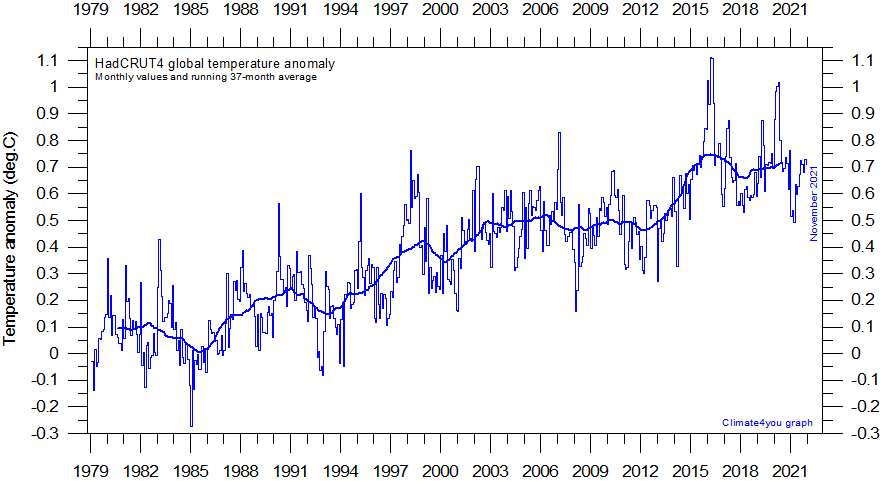
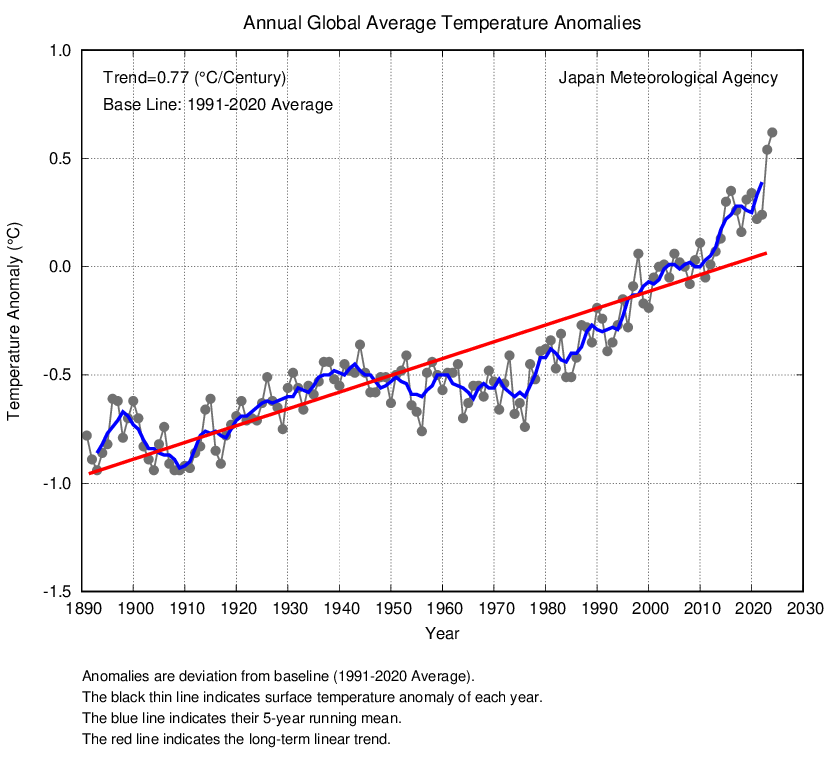
Handle this

951px-Global_Temperature_Anomaly.svg.png


HadCRUT4%20GlobalMonthlyTempSince1979%20With37monthRunningAverage%20With201505reference.gif


an_wld.png

OH MY GAWAD!

Your first chart is from GISS, a well known junk dataset. Hardly anyone apart from a few warmists use it anymore.

Second chart shows about a .55C warming total since 1979, which is around .15C per decade warming rate, well below the IPCC's predicted/projected per decade warming rate.

Third chart show a .73C per CENTURY warming rate right on it. about .07C per decade warming rate.

EPIC fail!

BWAHAHAHAHAHAHAHAHA ha hahahahahahah......ha ha ha..............................

Meanwhile you still haven't addressed the first post at all.
 
Find us a few mainstream climate scientists who think GISTEMP is well known junk.

All those charts show warming when you and yours claim global temperatures are dropping.

EPIC FAIL ! ! !
 
Find us a few mainstream climate scientists who think GISTEMP is well known junk.

All those charts show warming when you and yours claim global temperatures are dropping.

EPIC FAIL ! ! !

Ha ha ha, I never said it was dropping, you are flat out LYING!

Since I joined this forum, I have ALWAYS acknowledged that it has been warming, always showing that it warming LESS than what the IPCC predicted/projected said it should, which I did over and over right in front of you. You should stop LYING on this.

Already posted that GISS junk several times, here is the most recent one that YOU saw and ignored:

LINK
 
Your link goes to "Some failed climate predictions". GISTEMP is not a prediction. It is a record of global temperatures. GISTEMP agrees closely with data compiled by Hadley CRUT, the Japanese Meteorological Agency, Berkeley BEST and every other group assembling global temperature data.

That would be a FAIL on your part.
 

Forum List

Back
Top