Hansen's way of dealing with inconvenient history

What do you rely on when you don't have "empirical evidence"? Faith in political agendas.


Indeed.......the Rolling Thunder guy would gleefully buy a big old bag of dog poop for $1,000.00 a pop if it was packaged just right!!:2up: These people grow up in thatched cottages and fall for every single PC bullshit thing hook, line and stinker.

I bet you could find a NOAA graph during the 70's that predicted an ice age. The left has a graph prepared for every political event. That''s how they they are compensated with taxpayer funding.
 
Really? You're that petrified of a 0.4 degree rise? What do you think the temp swing is in your neck of the woods between winter and summer? Do you melt like a bowl of ice cream? Are you a bowl of ice cream?

Really??? You're that far gone in outright dementia that you think a more than one degree F rise in world average temperature (and still climbing) has anything to do with the temperature range between summer and winter? LOLOLOL. You are one walleyedretard, that's for sure. You must have a lot of befuddled fun comparing apples and elephants.
 
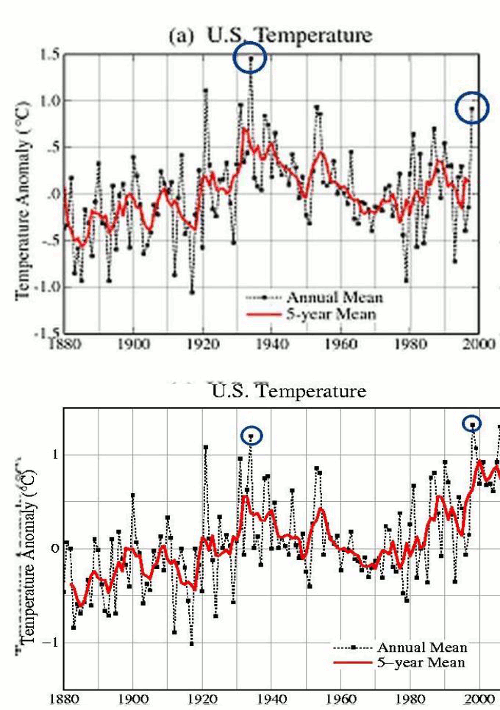
from NASA GISS: Science Briefs: Whither U.S. Climate?and of course the blink comparer to show how the data has been 'improved' since 1999
1998changesannotated.gif
You gotta love how these tinfoil hat deniers manufacture their conspiracy theories. these pinheads habitually bitch that many of the temperature stations are in bad locations and their data should be removed from the data set and a new data set should be charted without these poorly placed stations.

Then when the new data set is posted they cry foul because the data set changed. :cuckoo: The perfect catch-22 for deniers.

Ian, you have Christy and Spencer's UAH satellite chart as your icon, why don't you post a blink comparer of their data from when they deliberately used the opposite sign to adjust for diurnal satellite drift and after the correct sign was used and then accuse them of fudging the data too?!

Oh, that's Right, you would have to stop being a hypocrite.
Never mind.
 
Last edited:


0.4 Degrees!!!


w0w..............w0w!!!!!!!!!!!!!!


Gee......thats really mindnumbing s0n!!!:ack-1: Astounding actually..............


There are simply some people that you can toss onto any Likert Scale ( frequently used for charting mood for people with depressive disorders) and make one end of it HYSTERICAL.............. and no matter what you're trying to measure in life, they're going to tend to the hysterical end in most area's. We all know them in our lives.....the one's who you walk away from after a conversation and just shrug your shoulders and giggle your ass off!!!

Have you ever noticed that the most pompous and condescending CON$ are actually the stupidest??

The charts go from about -.4 or -.5 to about +.6 and the self professed genius does his "fuzzy math" and hysterically comes up with a change of +.4 :cuckoo:
BRILLIANT! :lol:
 
Really? You're that petrified of a 0.4 degree rise? What do you think the temp swing is in your neck of the woods between winter and summer? Do you melt like a bowl of ice cream? Are you a bowl of ice cream?
Another :asshole: know-it-all who can't read a chart or do simple arithmetic!!! :lol:
What do you rely on when you don't have "empirical evidence"? Faith in political agendas.
No, you rely on "fuzzy math" obviously!! :rofl::lmao:
 
Really? You're that petrified of a 0.4 degree rise? What do you think the temp swing is in your neck of the woods between winter and summer? Do you melt like a bowl of ice cream? Are you a bowl of ice cream?

Really??? You're that far gone in outright dementia that you think a more than one degree F rise in world average temperature (and still climbing) has anything to do with the temperature range between summer and winter? LOLOLOL. You are one walleyedretard, that's for sure. You must have a lot of befuddled fun comparing apples and elephants.


Why yes I do! Are you the apple or the orange? I can't quite make your color out because of the smoke in your room.:lol::lol::lol:
 
Really? You're that petrified of a 0.4 degree rise? What do you think the temp swing is in your neck of the woods between winter and summer? Do you melt like a bowl of ice cream? Are you a bowl of ice cream?
Another :asshole: know-it-all who can't read a chart or do simple arithmetic!!! :lol:
What do you rely on when you don't have "empirical evidence"? Faith in political agendas.
No, you rely on "fuzzy math" obviously!! :rofl::lmao:


Sure thing dood! We'll see how you guys try to spin the next decade or three as the globe continues to cool.
 
Really? You're that petrified of a 0.4 degree rise? What do you think the temp swing is in your neck of the woods between winter and summer? Do you melt like a bowl of ice cream? Are you a bowl of ice cream?
Another :asshole: know-it-all who can't read a chart or do simple arithmetic!!! :lol:
What do you rely on when you don't have "empirical evidence"? Faith in political agendas.
No, you rely on "fuzzy math" obviously!! :rofl::lmao:
Sure thing dood! We'll see how you guys try to spin the next decade or three as the globe continues to cool.
In order for the globe to "CONTINUE" to cool, it will have to start cooling first. But deniers always put the cart before the horse. :cuckoo:
 
Another :asshole: know-it-all who can't read a chart or do simple arithmetic!!! :lol:

No, you rely on "fuzzy math" obviously!! :rofl::lmao:
Sure thing dood! We'll see how you guys try to spin the next decade or three as the globe continues to cool.
In order for the globe to "CONTINUE" to cool, it will have to start cooling first. But deniers always put the cart before the horse. :cuckoo:


I guess you hadn't noticed that there are SEVEN ski resorts that are STILL OPEN! Here it is the Fourth of July and ski resorts are still getting paying customers. What I find particularly amusing is when it really was warm (before the year 2000) the mantra from you guys was there would be no more snow in winter. Now that it is getting cold your mantra is "well when it gets hot you get more snow because of water vapor....so riddle us this batman, why didn't it happen just a few years ago when it was really warmer? Hmmmm? You guys are a hoot!
 
http://stevengoddard.files.wordpress.com/2011/02/fig1x.gif?w=500&h=182 from NASA GISS: Science Briefs: Whither U.S. Climate?

hmmmm....the graphs appear to be corrupted.

here is a copy
http://stevengoddard.files.wordpress.com/2011/02/fig1x1.gif?w=500&h=182


and of course the blink comparer to show how the data has been 'improved' since 1999
http://stevengoddard.files.wordpress.com/2010/10/1998changesannotated.gif?w=500&h=355&h=355

the internet seems to have caused a problem with the 'memory hole' (Orwell's 1984)

and BTW, did any of you see it being discussed in the media that last year was the 23rd warmest year on record in the US? no? did you hear that 2010 was tied for the warmest year? of course you did.
More denier cult nonsense from oil industry stooge Stephen Goddard.

Here's the actual facts.

Despite Subtle Differences, Global Temperature Records in Close Agreement
NASA - GISS
January 13, 2011
(excerpts)

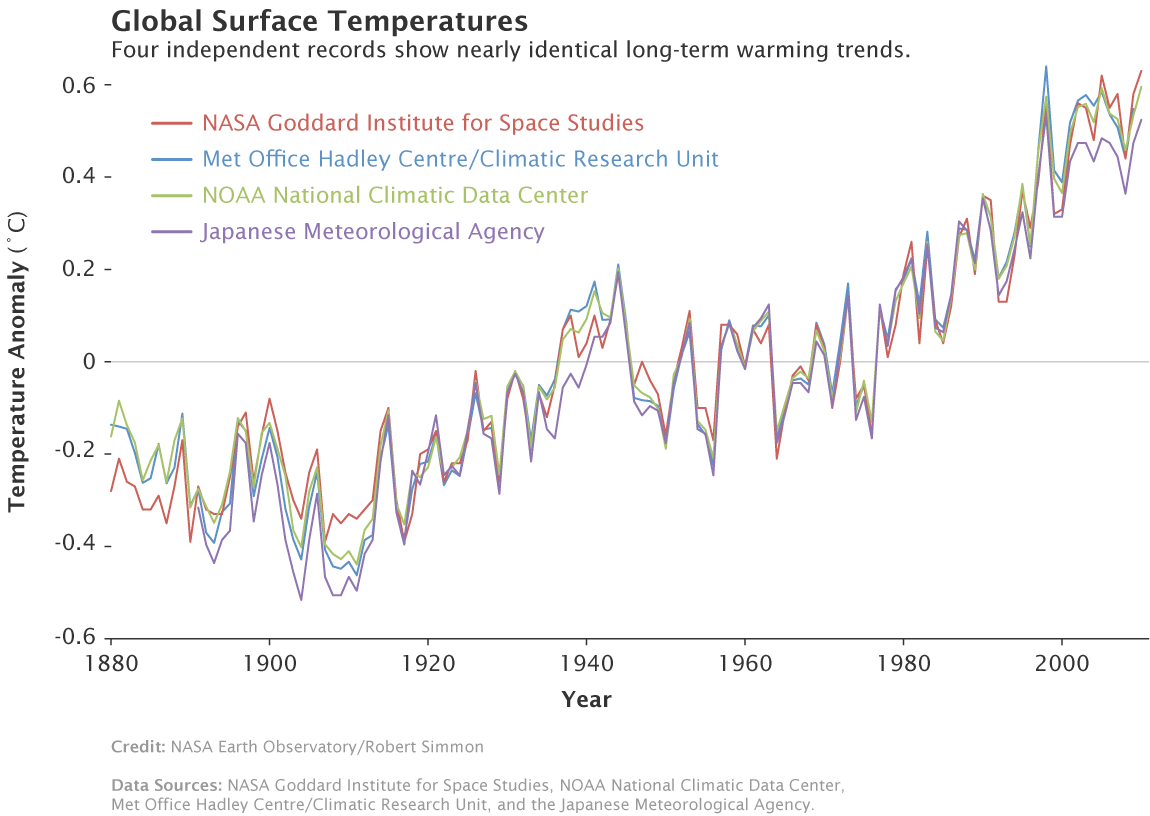
Groups of scientists from several major institutions — NASA's Goddard Institute for Space Studies (GISS), NOAA's National Climatic Data Center (NCDC), the Japanese Meteorological Agency and the Met Office Hadley Centre in the United Kingdom — tally data collected by temperature monitoring stations spread around the world and make an announcement about whether the previous year was a comparatively warm or cool year.

"The three official records vary slightly because of subtle differences in the way we analyze the data, but they agree extraordinarily well," said Dr. Reto Ruedy, one of Hansen's colleagues at GISS who helps analyze global surface temperatures.

All three records show peaks and valleys that vary in virtual sync with each other since 1880. All three show particularly rapid warming in the last few decades. And all three show the last decade is the warmest in the instrumental record.

Invariably, a great deal of attention centers on each year's ranking, but it is critical to focus on the decade-long trends that matter more, the GISS scientists emphasize. On that time scale, the three records are unequivocal: the last decade has been the warmest on record.

509983main_adjusted_annual_temperature_anomalies_final.gif

Multiple institutions monitor global surface temperatures. Despite subtle differences in the ways
the scientists perform their analyses, these four widely referenced records show remarkable agreement.
(Image credit: NASA Earth Observatory/Robert Simmon)


509796main_GISS_annual_temperature_anomalies_running.gif

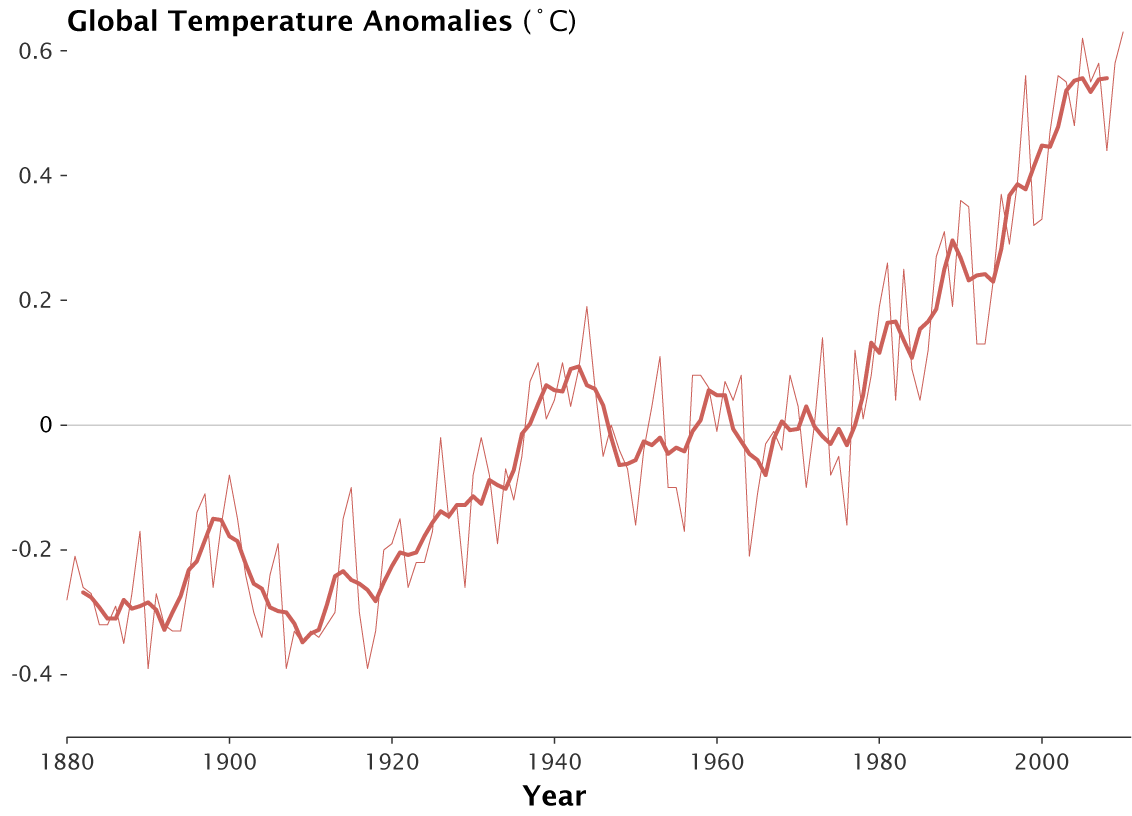
In 2010, global temperatures continued to rise. A new analysis from the Goddard Institute for Space Studies shows that
2010 tied with 2005 as the warmest year on record, and was part of the warmest decade on record. The thin line represents
annual data, while the thick line is a five-year running mean.
(Image credit: NASA Earth Observatory/Robert Simmon)


***

I would like to point out how Rolling Thunder has reframed the question from continental US temps to global temps. and Hansen has implied that the changes in contUS temps make very little difference in global temps because they only cover 2% of the globe.

but is that really the case? the US is the most measured and best measured area on earth. if the best data set on earth can easily be shown to have a significant fraction of its warming trend due to corrections and adjustments why should we think that other areas of the globe arent just as suseptible to improvements in their warming trends? the New Zealand temperature keeping bureau simply quit when they were commanded to explain and defend their bookkeeping. the Australian temperature figures are highly suspect as well. actually it seems like every place that someone investigates shows dubious adjustments that almost invariably raise the warming trend.

I am anxiously awaiting the Berkeley BEST data set to come out. perhaps it will be the same as the others but at least the raw figures and adjustments will be public. and maybe then we will know which of Hansen's numbers are the right ones.

Year Old New 2011
1934 1.23 1.25 1.195
1998 1.24 1.23 1.318
1921 1.12 1.15 1.080
2006 1.23 1.13 1.292
1931 1.08 1.08 0.965
1999 0.94 0.93 1.068
1953 0.91 0.90 0.859
1990 0.88 0.87 0.918
1938 0.85 0.86 0.750
1939 0.84 0.85 0.773
(New was 2007)

screenhunter3qk7.gif


I wish someone would make a three graph comparator
 
Last edited:
from NASA GISS: Science Briefs: Whither U.S. Climate?and of course the blink comparer to show how the data has been 'improved' since 1999
1998changesannotated.gif
You gotta love how these tinfoil hat deniers manufacture their conspiracy theories. these pinheads habitually bitch that many of the temperature stations are in bad locations and their data should be removed from the data set and a new data set should be charted without these poorly placed stations.

Then when the new data set is posted they cry foul because the data set changed. :cuckoo: The perfect catch-22 for deniers.

Ian, you have Christy and Spencer's UAH satellite chart as your icon, why don't you post a blink comparer of their data from when they deliberately used the opposite sign to adjust for diurnal satellite drift and after the correct sign was used and then accuse them of fudging the data too?!

Oh, that's Right, you would have to stop being a hypocrite.
Never mind.

please post up some links that tell the story of this great scandal at UAH. at least some pre-drift correction temps graphs. I have looked and all I find are collegiate error correcting papers between UAH and RSS. and the last two versions of RSS have been adjusted down to come in line with UAH. please, I really am interested in the information.
 
Sure thing dood! We'll see how you guys try to spin the next decade or three as the globe continues to cool.
In order for the globe to "CONTINUE" to cool, it will have to start cooling first. But deniers always put the cart before the horse. :cuckoo:
I guess you hadn't noticed that there are SEVEN ski resorts that are STILL OPEN! Here it is the Fourth of July and ski resorts are still getting paying customers. What I find particularly amusing is when it really was warm (before the year 2000) the mantra from you guys was there would be no more snow in winter. Now that it is getting cold your mantra is "well when it gets hot you get more snow because of water vapor....so riddle us this batman, why didn't it happen just a few years ago when it was really warmer? Hmmmm? You guys are a hoot!
You gotta love the "logic" of deniers, there's snow in the mountains so the whole globe is cooling. The decade AFTER 2000 was the WARMEST decade in the history of direct instrument measurement.
 
I would like to point out how Rolling Thunder has reframed the question from continental US temps to global temps. and Hansen has implied that the changes in contUS temps make very little difference in global temps because they only cover 2% of the globe.

but is that really the case? the US is the most measured and best measured area on earth...
I would like to point out that when Christy and Spencer at UAH were cooking the Troposphere satellite data, deniers were saying that only their satellite was the most accurate. I predicted then that when the Troposphere data no longer supported their denials, they would then switch to something/anything else they could dream up to support their denials. They haven't disappointed me. Now no satellite data is accurate since the UAH data can no longer be cooked and only the US ground data, that was worthless because it came from Hansen when the deniers were using the cooked UAH data, is suddenly the most accurate to determine the temperature of the whole globe. :cuckoo:
 
from NASA GISS: Science Briefs: Whither U.S. Climate?and of course the blink comparer to show how the data has been 'improved' since 1999
You gotta love how these tinfoil hat deniers manufacture their conspiracy theories. these pinheads habitually bitch that many of the temperature stations are in bad locations and their data should be removed from the data set and a new data set should be charted without these poorly placed stations.

Then when the new data set is posted they cry foul because the data set changed. :cuckoo: The perfect catch-22 for deniers.

Ian, you have Christy and Spencer's UAH satellite chart as your icon, why don't you post a blink comparer of their data from when they deliberately used the opposite sign to adjust for diurnal satellite drift and after the correct sign was used and then accuse them of fudging the data too?!

Oh, that's Right, you would have to stop being a hypocrite.
Never mind.

please post up some links that tell the story of this great scandal at UAH. at least some pre-drift correction temps graphs. I have looked and all I find are collegiate error correcting papers between UAH and RSS. and the last two versions of RSS have been adjusted down to come in line with UAH. please, I really am interested in the information.
They were posted for you at least a half a dozen times in other threads and every time you pretend they were never posted.

The CCSP SAP 1.1 Executive Summary co-written by Christy states:


Convening Lead Author: Tom M. L. Wigley, NSF NCAR
Lead Authors: V. Ramaswamy, NOAA; J.R. Christy, Univ. of AL
in Huntsville;
J.R. Lanzante, NOAA; C.A. Mears, Remote Sensing
Systems; B.D. Santer, DOE LLNL; C.K. Folland, U.K. Met Office


"Previously reported discrepancies between the amount of warming near the surface and higher in the atmosphere have been used to challenge the reliability of climate models and the reality of human induced global warming. Specifically, surface data showed substantial global-average warming, while early versions of satellite and radiosonde data showed little or no warming above the surface. This significant discrepancy no longer exists because errors in the satellite and radiosonde data have been identified and corrected. New data sets have also been developed that do not show such discrepancies."

I realize that the satellite readings were revised up and were less inconsistent with land based temps. I want to hear about the scandal that you keep talking about! where is the info on the deliberate miscalculations and cover up that you and Old Rocks keep implying? when RSS made a mathematical error in their program was that a scandal too? were Christie and Spencer found to have broken some rule of scientific methodology? did they hide their code? did they introduce some untested methodology that purposely twisted the results to read low? did they lie under oath? I want to know why you call it a scandal.
 
NASA GISS: Science Briefs: Whither U.S. Climate?

Science Briefs
Whither U.S. Climate?
By James Hansen, Reto Ruedy, Jay Glascoe and Makiko Sato — August 1999

What's happening to our climate? Was the heat wave and drought in the Eastern United States in 1999 a sign of global warming?

Empirical evidence does not lend much support to the notion that climate is headed precipitately toward more extreme heat and drought. The drought of 1999 covered a smaller area than the 1988 drought, when the Mississippi almost dried up. And 1988 was a temporary inconvenience as compared with repeated droughts during the 1930s "Dust Bowl" that caused an exodus from the prairies, as chronicled in Steinbeck's Grapes of Wrath.

How can the absence of clear climate change in the United States be reconciled with continued reports of record global temperature? Part of the "answer" is that U.S. climate has been following a different course than global climate, at least so far. Figure 1 compares the temperature history in the U.S. and the world for the past 120 years. The U.S. has warmed during the past century, but the warming hardly exceeds year-to-year variability. Indeed, in the U.S. the warmest decade was the 1930s and the warmest year was 1934. Global temperature, in contrast, had passed 1930s values by 1980 and the world has warmed at a remarkable rate over the last 25 years.

So when you and Chris post your stupid "ZOMG!!! record temp in Cheboygan!! Killa Tornadoz!" posts, Im going to repost the above
That's different. Somehow. It just is.
 
please post up some links that tell the story of this great scandal at UAH. at least some pre-drift correction temps graphs. I have looked and all I find are collegiate error correcting papers between UAH and RSS. and the last two versions of RSS have been adjusted down to come in line with UAH. please, I really am interested in the information.
They were posted for you at least a half a dozen times in other threads and every time you pretend they were never posted.

The CCSP SAP 1.1 Executive Summary co-written by Christy states:


Convening Lead Author: Tom M. L. Wigley, NSF NCAR
Lead Authors: V. Ramaswamy, NOAA; J.R. Christy, Univ. of AL
in Huntsville;
J.R. Lanzante, NOAA; C.A. Mears, Remote Sensing
Systems; B.D. Santer, DOE LLNL; C.K. Folland, U.K. Met Office


"Previously reported discrepancies between the amount of warming near the surface and higher in the atmosphere have been used to challenge the reliability of climate models and the reality of human induced global warming. Specifically, surface data showed substantial global-average warming, while early versions of satellite and radiosonde data showed little or no warming above the surface. This significant discrepancy no longer exists because errors in the satellite and radiosonde data have been identified and corrected. New data sets have also been developed that do not show such discrepancies."

I realize that the satellite readings were revised up and were less inconsistent with land based temps. I want to hear about the scandal that you keep talking about! where is the info on the deliberate miscalculations and cover up that you and Old Rocks keep implying? when RSS made a mathematical error in their program was that a scandal too? were Christie and Spencer found to have broken some rule of scientific methodology? did they hide their code? did they introduce some untested methodology that purposely twisted the results to read low? did they lie under oath? I want to know why you call it a scandal.
While Christy and Spencer were fudging the data, deniers said they were the foremost experts on satellite data and all the others were ignorant Hansen puppets.

So to believe that the foremost experts on satellite data calculations BOTH didn't know the correct sign to use to correct for diurnal satellite drift, which all the inferior satellite people got right, and without bothering to look it up just happened to GUESS the sign that turned global warming into global cooling was an honest mistake is beyond any level of gullibility.
 
In order for the globe to "CONTINUE" to cool, it will have to start cooling first. But deniers always put the cart before the horse. :cuckoo:
I guess you hadn't noticed that there are SEVEN ski resorts that are STILL OPEN! Here it is the Fourth of July and ski resorts are still getting paying customers. What I find particularly amusing is when it really was warm (before the year 2000) the mantra from you guys was there would be no more snow in winter. Now that it is getting cold your mantra is "well when it gets hot you get more snow because of water vapor....so riddle us this batman, why didn't it happen just a few years ago when it was really warmer? Hmmmm? You guys are a hoot!
You gotta love the "logic" of deniers, there's snow in the mountains so the whole globe is cooling. The decade AFTER 2000 was the WARMEST decade in the history of direct instrument measurement.


No, once again you don't get it. Try again.
 
I guess you hadn't noticed that there are SEVEN ski resorts that are STILL OPEN! Here it is the Fourth of July and ski resorts are still getting paying customers. What I find particularly amusing is when it really was warm (before the year 2000) the mantra from you guys was there would be no more snow in winter. Now that it is getting cold your mantra is "well when it gets hot you get more snow because of water vapor....so riddle us this batman, why didn't it happen just a few years ago when it was really warmer? Hmmmm? You guys are a hoot!
You gotta love the "logic" of deniers, there's snow in the mountains so the whole globe is cooling. The decade AFTER 2000 was the WARMEST decade in the history of direct instrument measurement.
No, once again you don't get it. Try again.
Actually I do get it, no matter how many ski resorts are open, the decade AFTER 2000 was STILL the WARMEST decade in the history of direct instrument measurement. So if, as you said, it was REALLY warm before 2000, it must be REALLY REALLY warm after 2000, and you have egg on your face.
 

Forum List

Back
Top