wirebender
Senior Member
One is the global temperature, one is the US temperature. And your problem is what?
You really aren't able to read a graph are you?
Follow along with the video below to see how to install our site as a web app on your home screen.

Note: This feature currently requires accessing the site using the built-in Safari browser.
One is the global temperature, one is the US temperature. And your problem is what?
One is the global temperature, one is the US temperature. And your problem is what?
You really aren't able to read a graph are you?
he finds some graphs easier to read than others.
any other warmers out there feel like explaining why wholesale changes were made post-1999? the reason, not the method.
hahaha. it wouldnt be the first time OR ducked questiins about the integrity of his heroes.
What I truly don't get is why people take this debate so personally
When people cannot agree on the data debating its significance is pointless.
So now the global weirding debate becomes a debate about which data sets are real.
And all one can do under those circumstances is try to make the case that one data set is superior to the other.
But instead the debate becomes nothing but silly character assassination.
Why?
More denier cult nonsense from oil industry stooge Stephen Goddard.http://stevengoddard.files.wordpress.com/2011/02/fig1x.gif?w=500&h=182 from NASA GISS: Science Briefs: Whither U.S. Climate?
hmmmm....the graphs appear to be corrupted.
here is a copy
http://stevengoddard.files.wordpress.com/2011/02/fig1x1.gif?w=500&h=182
and of course the blink comparer to show how the data has been 'improved' since 1999
http://stevengoddard.files.wordpress.com/2010/10/1998changesannotated.gif?w=500&h=355&h=355
the internet seems to have caused a problem with the 'memory hole' (Orwell's 1984)
and BTW, did any of you see it being discussed in the media that last year was the 23rd warmest year on record in the US? no? did you hear that 2010 was tied for the warmest year? of course you did.
Here's the actual facts.
Despite Subtle Differences, Global Temperature Records in Close Agreement
NASA - GISS
January 13, 2011
(excerpts)
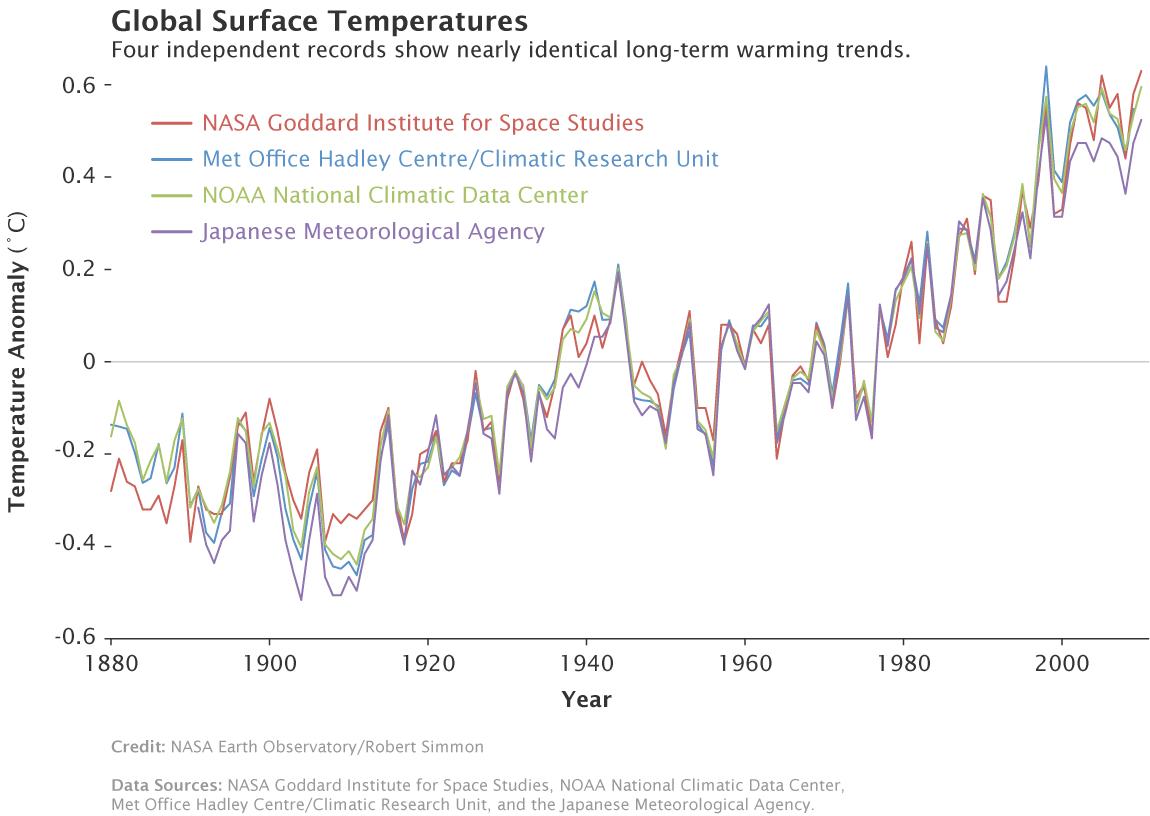
Groups of scientists from several major institutions — NASA's Goddard Institute for Space Studies (GISS), NOAA's National Climatic Data Center (NCDC), the Japanese Meteorological Agency and the Met Office Hadley Centre in the United Kingdom — tally data collected by temperature monitoring stations spread around the world and make an announcement about whether the previous year was a comparatively warm or cool year.
"The three official records vary slightly because of subtle differences in the way we analyze the data, but they agree extraordinarily well," said Dr. Reto Ruedy, one of Hansen's colleagues at GISS who helps analyze global surface temperatures.
All three records show peaks and valleys that vary in virtual sync with each other since 1880. All three show particularly rapid warming in the last few decades. And all three show the last decade is the warmest in the instrumental record.
Invariably, a great deal of attention centers on each year's ranking, but it is critical to focus on the decade-long trends that matter more, the GISS scientists emphasize. On that time scale, the three records are unequivocal: the last decade has been the warmest on record.
Multiple institutions monitor global surface temperatures. Despite subtle differences in the ways
the scientists perform their analyses, these four widely referenced records show remarkable agreement.
(Image credit: NASA Earth Observatory/Robert Simmon)
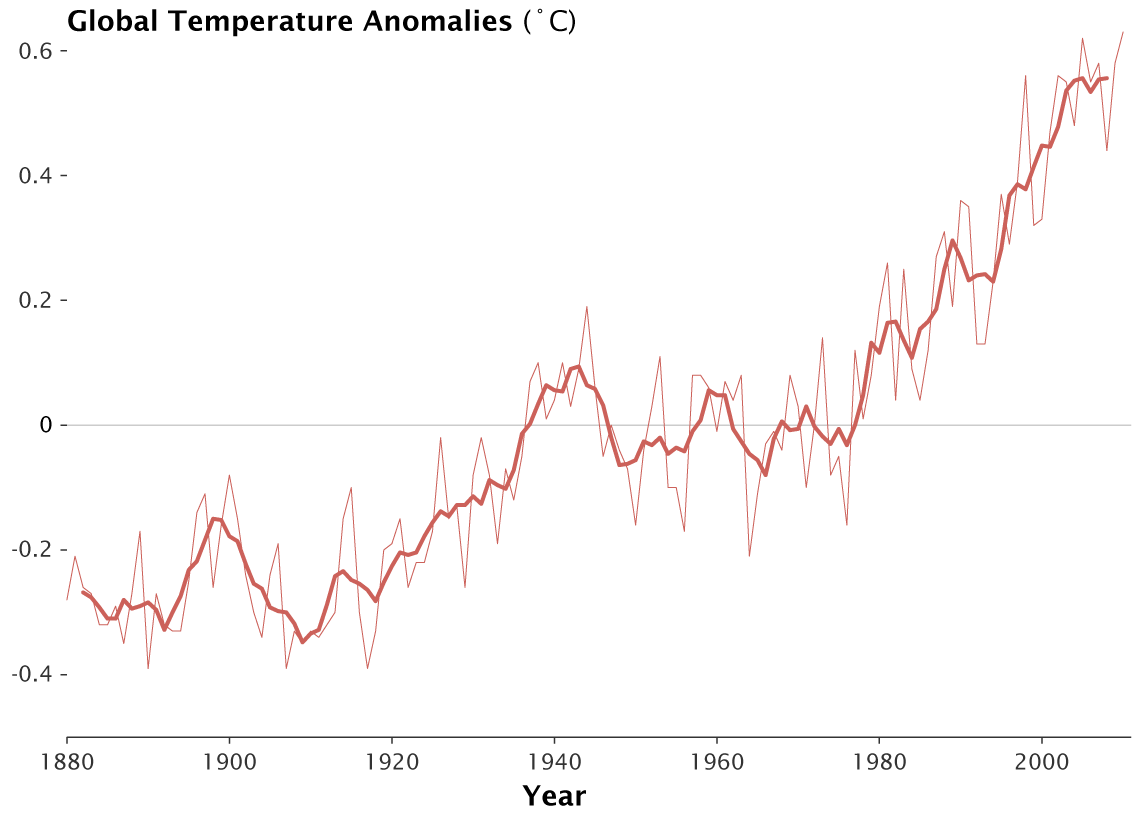
In 2010, global temperatures continued to rise. A new analysis from the Goddard Institute for Space Studies shows that
2010 tied with 2005 as the warmest year on record, and was part of the warmest decade on record. The thin line represents
annual data, while the thick line is a five-year running mean.
(Image credit: NASA Earth Observatory/Robert Simmon)
***
 Astounding actually..............
I guess everything must "astound" clueless retards like you, kookster. Here's something else to "astound" you.0.4 Degrees!!!
w0w..............w0w!!!!!!!!!!!!!!
Gee......thats really mindnumbing s0n!!!Astounding actually..............
There are simply some people (the kookster is a good example) that you can toss onto any intelligence distribution curve and they wind up down in the thin part of the curve at the low end marked "extremely retarded". We all know them from encounters in daily life and from watching rightwingnut politicians and FauxNews talking heads make fools of themselves.....the ones who you laugh at for their clueless stupidity, abysmal ignorance and brainwashed allegiance to the 'retard party' line. These people fill the ranks of the deluded dingbats of the astro-turfed cult of AGW denial that the fossil fuel industry has ginned up.There are simply some people that you can toss onto any Likert Scale ( frequently used for charting mood for people with depressive disorders) and make one end of it HYSTERICAL.............. and no matter what you're trying to measure in life, they're going to tend to the hysterical end in most area's. We all know them in our lives.....the one's who you walk away from after a conversation and just shrug your shoulders and giggle your ass off!!!
I guess everything must "astound" clueless retards like you, kookster. Here's something else to "astound" you.0.4 Degrees!!!
w0w..............w0w!!!!!!!!!!!!!!
Gee......thats really mindnumbing s0n!!!
Global Temperatures
The year 2010 tied with 2005 as the warmest year since records began in 1880. The annual global combined land and ocean surface temperature was 0.62°C (1.12°F) above the 20th century average. The range associated with this value is plus or minus 0.07°C (0.13°F). The 2010 combined land and ocean surface temperature in the Northern Hemisphere was also the warmest on record, while the combined land and ocean surface temperature in the Southern Hemisphere was the sixth warmest such period on record. The annual globally averaged land temperature was 0.96°C (1.73°F) above average, which tied with 2005 as the second warmest year record. The range associated with this value is plus or minus 0.11°C (0.20°F). The warmest year was 2007, at 0.99°C (1.78°F) above the 20th century average. The decadal global land and ocean average temperature anomaly for 20012010 was the warmest decade on record for the globe, with a surface global temperature of 0.56°C (1.01°F) above the 20th century average. This surpassed the previous decadal record (19912000) value of 0.36°C (0.65°F).
There are simply some people (the kookster is a good example) that you can toss onto any intelligence distribution curve and they wind up down in the thin part of the curve at the low end marked "extremely retarded". We all know them from encounters in daily life and from watching rightwingnut politicians and FauxNews talking heads make fools of themselves.....the one's who you laugh at for their clueless stupidity, abysmal ignorance and brainwashed allegiance to the 'retard party' line. These people fill the ranks of the deluded dingbats of the astro-turfed cult of AGW denial that the fossil fuel industry has ginned up.There are simply some people that you can toss onto any Likert Scale ( frequently used for charting mood for people with depressive disorders) and make one end of it HYSTERICAL.............. and no matter what you're trying to measure in life, they're going to tend to the hysterical end in most area's. We all know them in our lives.....the one's who you walk away from after a conversation and just shrug your shoulders and giggle your ass off!!!

What do you rely on when you don't have "empirical evidence"? Faith in political agendas.
 These people grow up in thatched cottages and fall for every single PC bullshit thing hook, line and stinker.
More denier cult nonsense from oil industry stooge Stephen Goddard.http://stevengoddard.files.wordpress.com/2011/02/fig1x.gif?w=500&h=182 from NASA GISS: Science Briefs: Whither U.S. Climate?
hmmmm....the graphs appear to be corrupted.
here is a copy
http://stevengoddard.files.wordpress.com/2011/02/fig1x1.gif?w=500&h=182
and of course the blink comparer to show how the data has been 'improved' since 1999
http://stevengoddard.files.wordpress.com/2010/10/1998changesannotated.gif?w=500&h=355&h=355
the internet seems to have caused a problem with the 'memory hole' (Orwell's 1984)
and BTW, did any of you see it being discussed in the media that last year was the 23rd warmest year on record in the US? no? did you hear that 2010 was tied for the warmest year? of course you did.
Here's the actual facts.
Despite Subtle Differences, Global Temperature Records in Close Agreement
NASA - GISS
January 13, 2011
(excerpts)
Groups of scientists from several major institutions NASA's Goddard Institute for Space Studies (GISS), NOAA's National Climatic Data Center (NCDC), the Japanese Meteorological Agency and the Met Office Hadley Centre in the United Kingdom tally data collected by temperature monitoring stations spread around the world and make an announcement about whether the previous year was a comparatively warm or cool year.
"The three official records vary slightly because of subtle differences in the way we analyze the data, but they agree extraordinarily well," said Dr. Reto Ruedy, one of Hansen's colleagues at GISS who helps analyze global surface temperatures.
All three records show peaks and valleys that vary in virtual sync with each other since 1880. All three show particularly rapid warming in the last few decades. And all three show the last decade is the warmest in the instrumental record.
Invariably, a great deal of attention centers on each year's ranking, but it is critical to focus on the decade-long trends that matter more, the GISS scientists emphasize. On that time scale, the three records are unequivocal: the last decade has been the warmest on record.
Multiple institutions monitor global surface temperatures. Despite subtle differences in the ways
the scientists perform their analyses, these four widely referenced records show remarkable agreement.
(Image credit: NASA Earth Observatory/Robert Simmon)
In 2010, global temperatures continued to rise. A new analysis from the Goddard Institute for Space Studies shows that
2010 tied with 2005 as the warmest year on record, and was part of the warmest decade on record. The thin line represents
annual data, while the thick line is a five-year running mean.
(Image credit: NASA Earth Observatory/Robert Simmon)
***