Hansen's way of dealing with inconvenient history

IanC

Gold Member
Sep 22, 2009
11,061
1,344
245
fig1x.gif
from http://www.giss.nasa.gov/research/briefs/hansen_07/

hmmmm....the graphs appear to be corrupted.

here is a copy
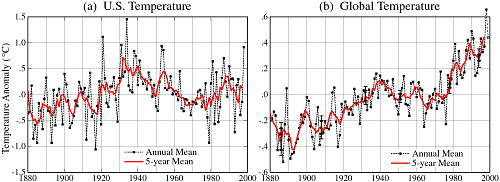
fig1x1.gif


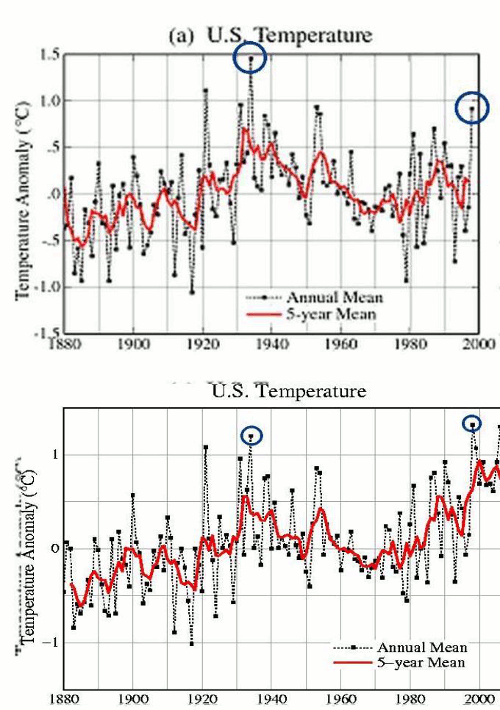
and of course the blink comparer to show how the data has been 'improved' since 1999
1998changesannotated.gif


the internet seems to have caused a problem with the 'memory hole' (Orwell's 1984)

and BTW, did any of you see it being discussed in the media that last year was the 23rd warmest year on record in the US? no? did you hear that 2010 was tied for the warmest year? of course you did.
 
Last edited:
Hey if we are having a big ol winter storm in the northern US we cannot be having global warming can we?
 
One is the global temperature, one is the US temperature. And your problem is what?

my problem is that an incovenient graph on the NASA GISS site just happened to develop a problem in 2011. wouldnt it be interesting to be able to see every year's graph?

Old Rocks - do you think it is reasonable that past history data is changed every year?
 
NASA GISS: Science Briefs: Whither U.S. Climate?

Science Briefs
Whither U.S. Climate?
By James Hansen, Reto Ruedy, Jay Glascoe and Makiko Sato — August 1999

What's happening to our climate? Was the heat wave and drought in the Eastern United States in 1999 a sign of global warming?

Empirical evidence does not lend much support to the notion that climate is headed precipitately toward more extreme heat and drought. The drought of 1999 covered a smaller area than the 1988 drought, when the Mississippi almost dried up. And 1988 was a temporary inconvenience as compared with repeated droughts during the 1930s "Dust Bowl" that caused an exodus from the prairies, as chronicled in Steinbeck's Grapes of Wrath.

How can the absence of clear climate change in the United States be reconciled with continued reports of record global temperature? Part of the "answer" is that U.S. climate has been following a different course than global climate, at least so far. Figure 1 compares the temperature history in the U.S. and the world for the past 120 years. The U.S. has warmed during the past century, but the warming hardly exceeds year-to-year variability. Indeed, in the U.S. the warmest decade was the 1930s and the warmest year was 1934. Global temperature, in contrast, had passed 1930s values by 1980 and the world has warmed at a remarkable rate over the last 25 years.
 
NASA GISS: Science Briefs: Whither U.S. Climate?

The upshot is that we will be able to understand climate change well only with the help of global climate models that are able to incorporate all of these mechanisms on an equal footing. We will be able to test our understanding during the era of satellite measurements, when all of these forcing factors can be measured accurately.

In the meantime, we can venture two "predictions" on "whither U.S. climate". First, regarding U.S. temperature, we have argued (Hansen et al., 1999a) that the next decade will be warmer than the 1990s, rivaling if not exceeding the 1930s. The basis for that prediction is the expectation of continued greenhouse warming and probable slackening of regional ocean cooling. Second, regarding precipitation and drought, even without analysis of regional patterns of change, we can offer the probabilistic statement that the frequencies of both extremes, heavy precipitation and floods on the one hand and droughts and forest fires on the other, will increase with increasing global temperature. The rationale for this (Hansen et al., 1991) is that increased surface heating increases evaporation, and this increases the intensity of both precipitation and drought conditions where and when they occur.

More quantitative predictions should be possible soon based on global climate models and satellite observations. Model runs for the past 50 years suggest that it is possible to simulate regional climate trends realistically. Simulations for the future will depend upon estimates of trends in climate forcings derived from global satellite observations and analyses.
 
NASA GISS: Science Briefs: Whither U.S. Climate?

Science Briefs
Whither U.S. Climate?
By James Hansen, Reto Ruedy, Jay Glascoe and Makiko Sato — August 1999

What's happening to our climate? Was the heat wave and drought in the Eastern United States in 1999 a sign of global warming?

Empirical evidence does not lend much support to the notion that climate is headed precipitately toward more extreme heat and drought. The drought of 1999 covered a smaller area than the 1988 drought, when the Mississippi almost dried up. And 1988 was a temporary inconvenience as compared with repeated droughts during the 1930s "Dust Bowl" that caused an exodus from the prairies, as chronicled in Steinbeck's Grapes of Wrath.

How can the absence of clear climate change in the United States be reconciled with continued reports of record global temperature? Part of the "answer" is that U.S. climate has been following a different course than global climate, at least so far. Figure 1 compares the temperature history in the U.S. and the world for the past 120 years. The U.S. has warmed during the past century, but the warming hardly exceeds year-to-year variability. Indeed, in the U.S. the warmest decade was the 1930s and the warmest year was 1934. Global temperature, in contrast, had passed 1930s values by 1980 and the world has warmed at a remarkable rate over the last 25 years.


Answer IanC's question olfraud. Is it OK to continuously go back and falsify data?
 
I see two graphs above, one labeled US, the other Global. And a blink comparator that seems to be comparing them under the label of US.
 
Sierra Snowfall

Taken together, this study and previous studies paint a picture of a California Sierra snowpack responding rapidly to the changing climate of the past few decades. These trends are likely to continue.

http://www.energy.ca.gov/2009publications/CEC-500-2009-016/CEC-500-2009-016-D.PDF


It sure does. Every part of the Sierra Snowpack is above normal. Statewide the levels are 130% above normal, in the northern Sierra it is 105%, the central Sirrea are tracking at 126% above, and the southern Sierra is registering 166% ABOVE normal.

DLYSWEQ
 
I see two graphs above, one labeled US, the other Global. And a blink comparator that seems to be comparing them under the label of US.


Yes, it appears that Hansen is trying to conform the US record to the Global. Why?
 
NASA GISS: Science Briefs: Whither U.S. Climate?

Science Briefs
Whither U.S. Climate?
By James Hansen, Reto Ruedy, Jay Glascoe and Makiko Sato — August 1999

What's happening to our climate? Was the heat wave and drought in the Eastern United States in 1999 a sign of global warming?

Empirical evidence does not lend much support to the notion that climate is headed precipitately toward more extreme heat and drought. The drought of 1999 covered a smaller area than the 1988 drought, when the Mississippi almost dried up. And 1988 was a temporary inconvenience as compared with repeated droughts during the 1930s "Dust Bowl" that caused an exodus from the prairies, as chronicled in Steinbeck's Grapes of Wrath.

How can the absence of clear climate change in the United States be reconciled with continued reports of record global temperature? Part of the "answer" is that U.S. climate has been following a different course than global climate, at least so far. Figure 1 compares the temperature history in the U.S. and the world for the past 120 years. The U.S. has warmed during the past century, but the warming hardly exceeds year-to-year variability. Indeed, in the U.S. the warmest decade was the 1930s and the warmest year was 1934. Global temperature, in contrast, had passed 1930s values by 1980 and the world has warmed at a remarkable rate over the last 25 years.

indeed! the models show that the northern hemisphere should be warming at a great rate but the US temps are much lower. and what area in the northern hemisphere has the best measurements? The US. odd that! it always seems that the best data shows the least warming.

and I still dont know why the 30's went down and the 90's went up but Im sure Hansen could come up with some excuse right? perhaps the data needed to go back to the shop because 'on of the lights wouldnt light up on one side' (said the grinch to cindy lou who)
 
I see two graphs above, one labeled US, the other Global. And a blink comparator that seems to be comparing them under the label of US.

what??????

I think you are pretending to be obtuse Old Rocks. You have seen that blink comparer enough times to know that it is comparing US1999 data to post US1999 data. the whole point of this thread is to show that Hansen wanted US temps to look like global temps and magically it happened. as you can easily see, even after Hansen's manipulation, the later US graph does not line up with the global graph and the scale is different.

1998changesannotated.gif

fig1x1.gif


Old Rocks- do you not find it unsettling that the obviously different and inconvenient pre-1999 graph has mysteriously become corrupted? are you not concerned that the shape of the graph significantly changed? I could sorta understand an offset but this sort of wholesale change of trends is beyond the pale.
 
Last edited:
I see two graphs above, one labeled US, the other Global. And a blink comparator that seems to be comparing them under the label of US.

what??????

I think you are pretending to be obtuse Old Rocks. You have seen that blink comparer enough times to know that it is comparing US1999 data to post US1999 data. the whole point of this thread is to show that Hansen wanted US temps to look like global temps and magically it happened. as you can easily see, even after Hansen's manipulation, the later US graph does not line up with the global graph and the scale is different.

1998changesannotated.gif

fig1x1.gif


Old Rocks- do you not find it unsettling that the obviously different and inconvenient pre-1999 graph has mysteriously become corrupted? are you not concerned that the shape of the graph significantly changed? I could sorta understand an offset but this sort of wholesale change of trends is beyond the pale.


olfraud could care less about scientific accuracy, he's a shill for the like's of Goldman Sachs and all those other leeches stealing the taxpayers money.
 
Last edited:
I see two graphs above, one labeled US, the other Global. And a blink comparator that seems to be comparing them under the label of US.

what??????

I think you are pretending to be obtuse Old Rocks. You have seen that blink comparer enough times to know that it is comparing US1999 data to post US1999 data. the whole point of this thread is to show that Hansen wanted US temps to look like global temps and magically it happened. as you can easily see, even after Hansen's manipulation, the later US graph does not line up with the global graph and the scale is different.

1998changesannotated.gif

fig1x1.gif


Old Rocks- do you not find it unsettling that the obviously different and inconvenient pre-1999 graph has mysteriously become corrupted? are you not concerned that the shape of the graph significantly changed? I could sorta understand an offset but this sort of wholesale change of trends is beyond the pale.


while looking for the link to the blink comparer I found this old thread. for what its worth Hansen has put up the original non corrupted graphs up again.

but we see that Old Rocks has ducked the issue, as he so often does.

so I will ask again---does it bother you Old Rocks that your hero Hansen manipulates his data set to produce visuals that are more supportive of the AGW cause? do you honestly think that some stunning new evidence or data was discovered after 1999 that reduced the US1934 temperature and increased the US1998 temp? as well as man, many of the other readings? does it bother you, or give you pause to think, that the changes are almost invariably in the direction of increased global warming. the exception was the drop in some temps after McIntyre found the Y2K bug but those were quickly increased again once the publicity died down. will you answer this time Old Rocks?
 

Forum List

Back
Top