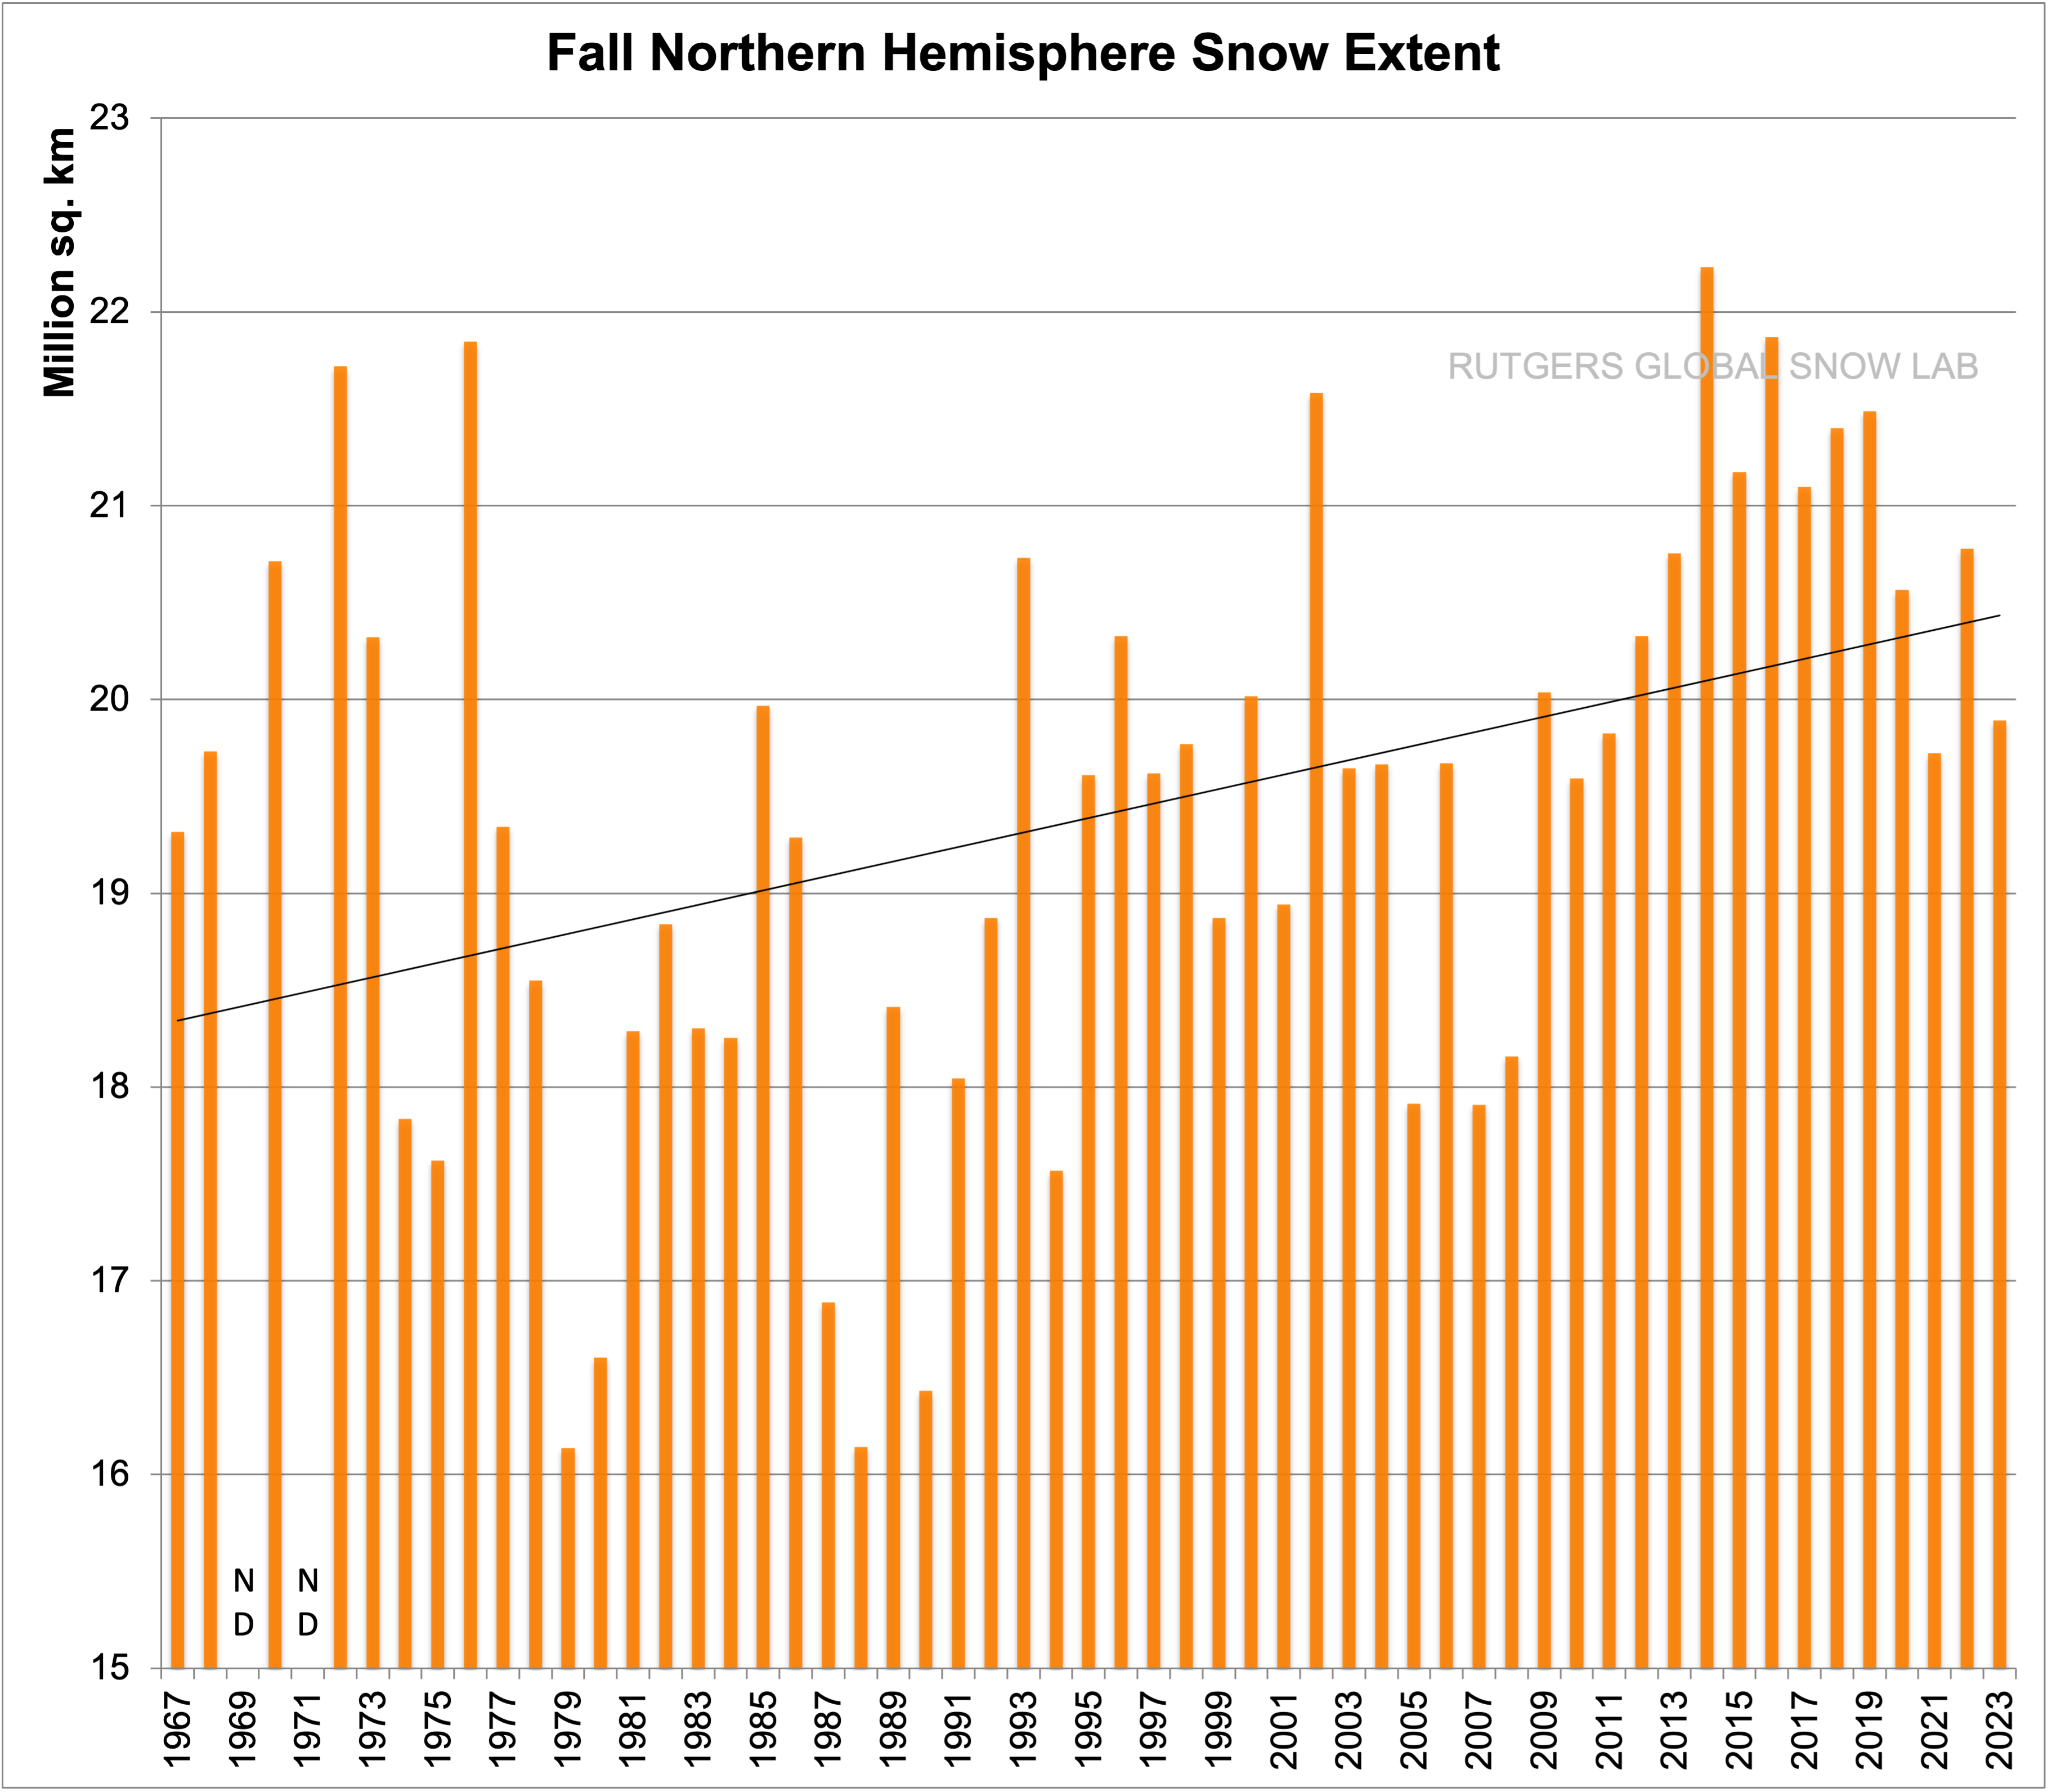
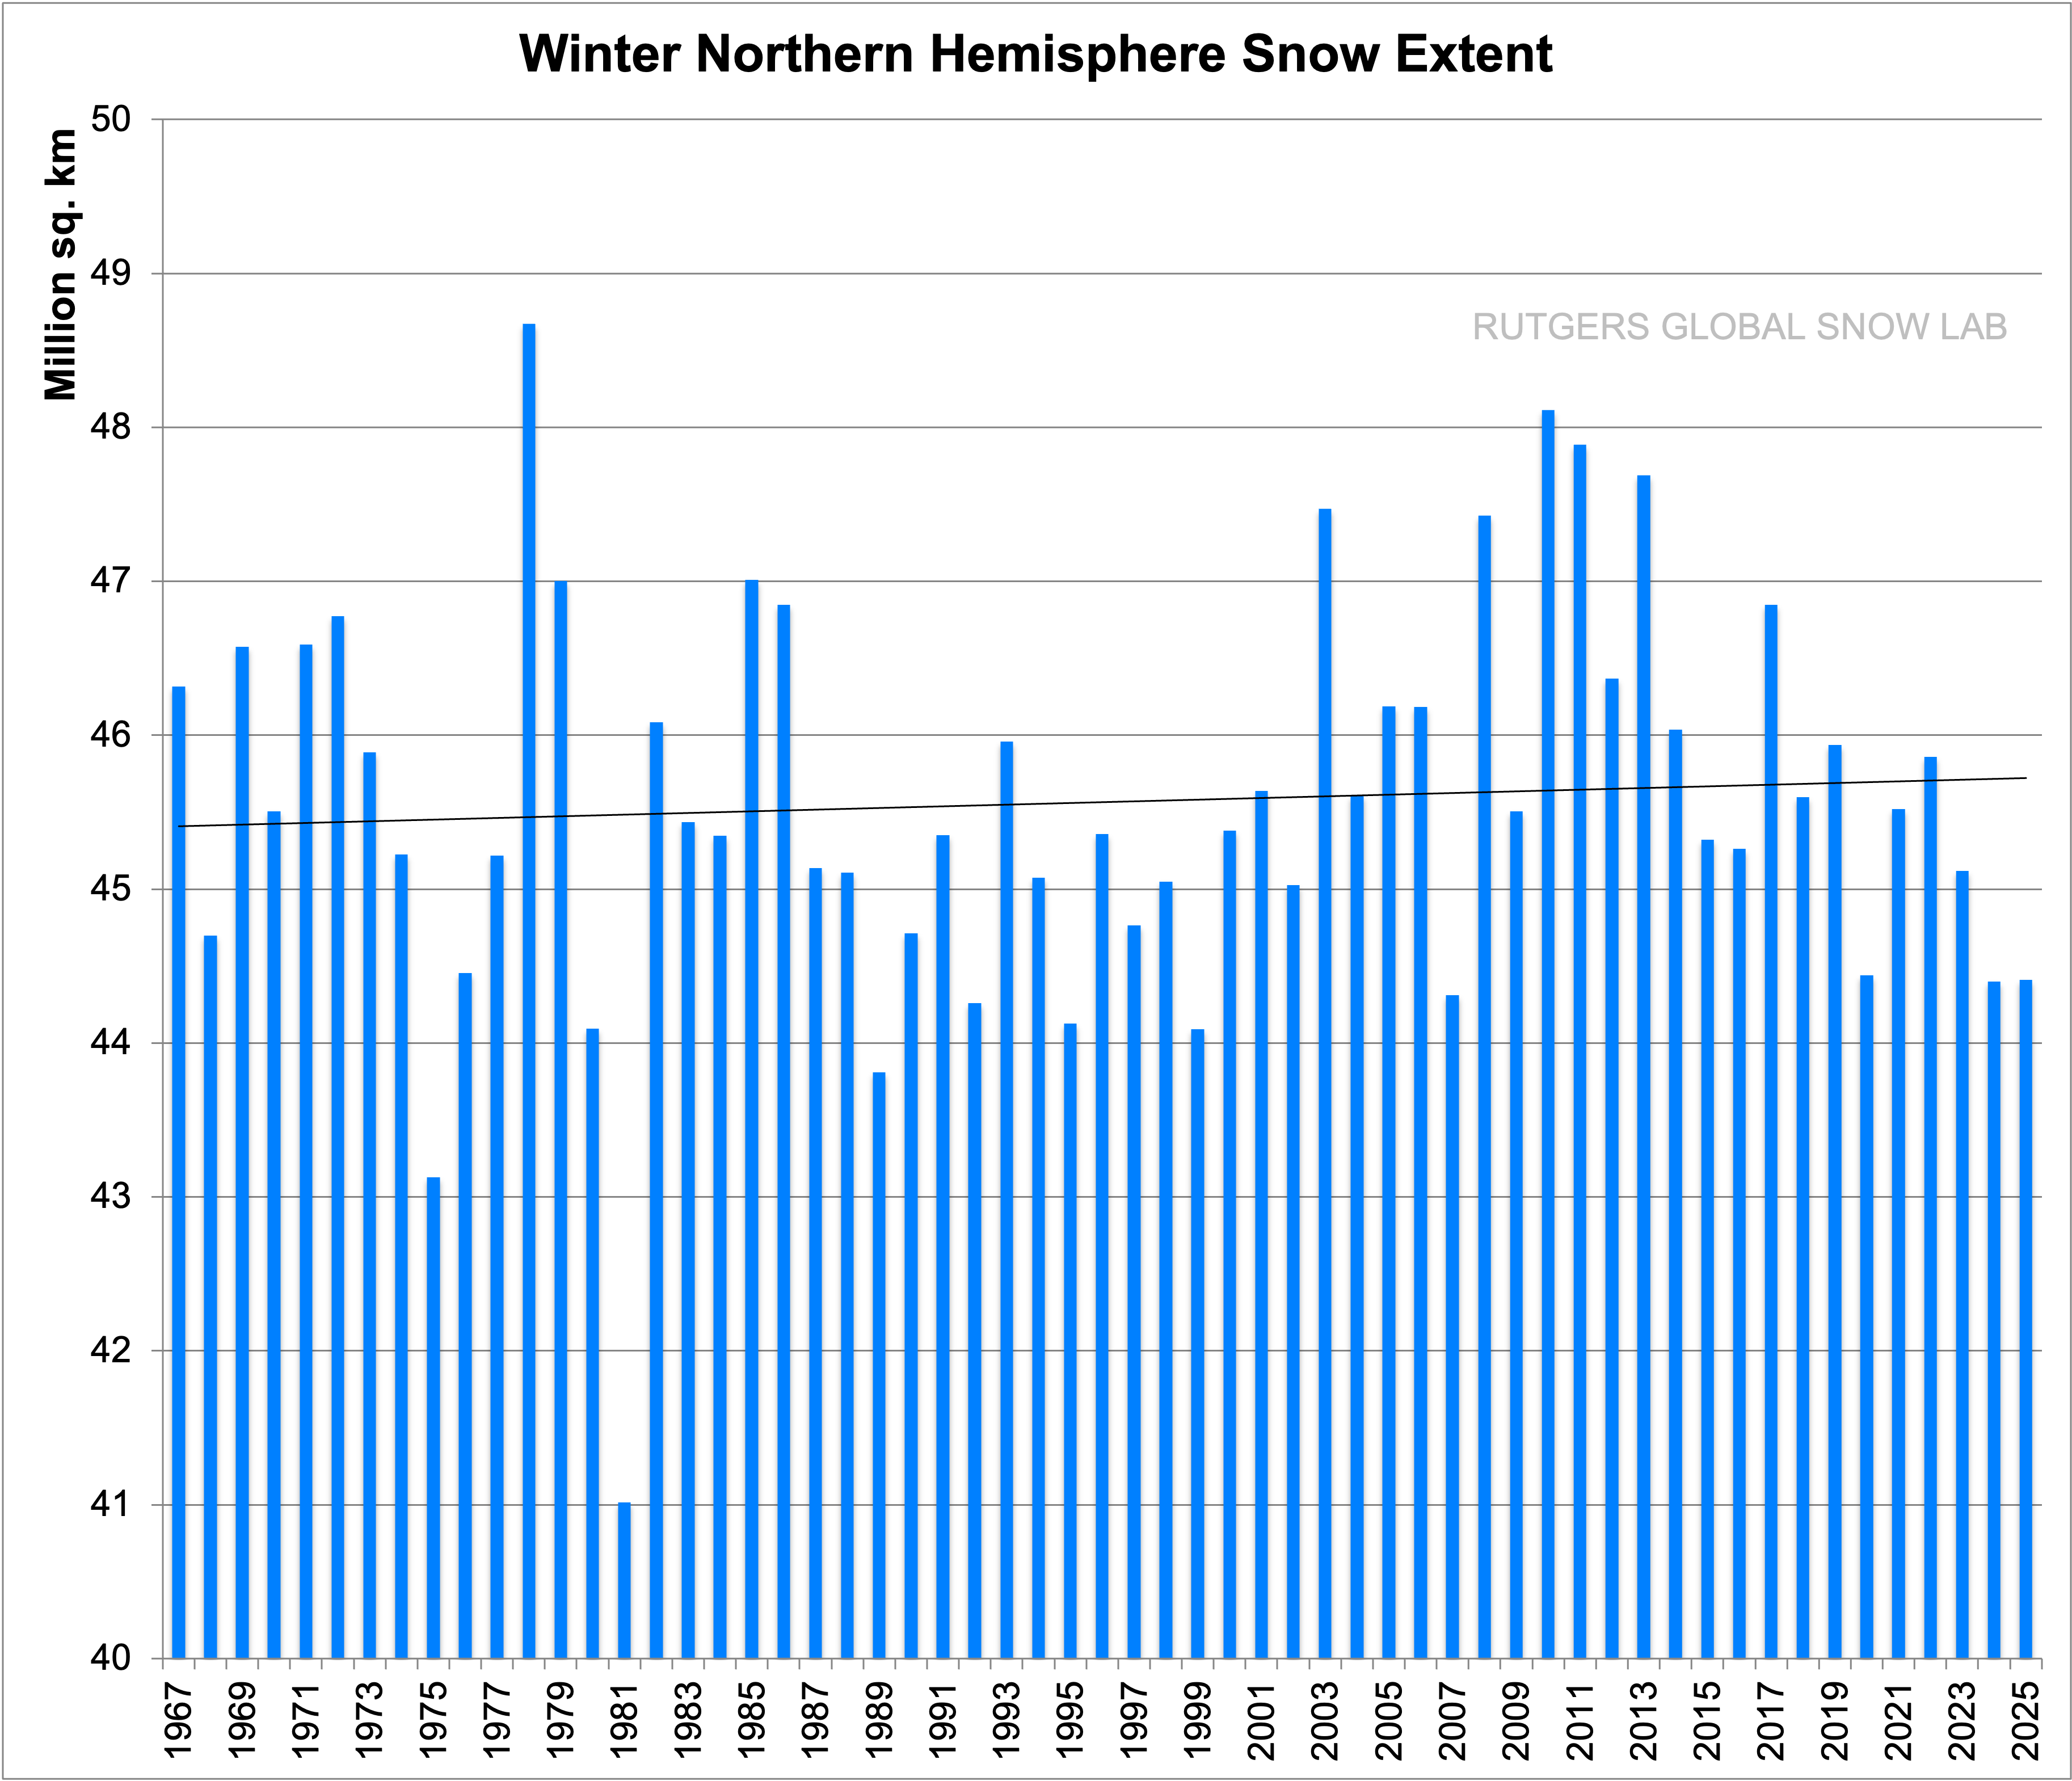
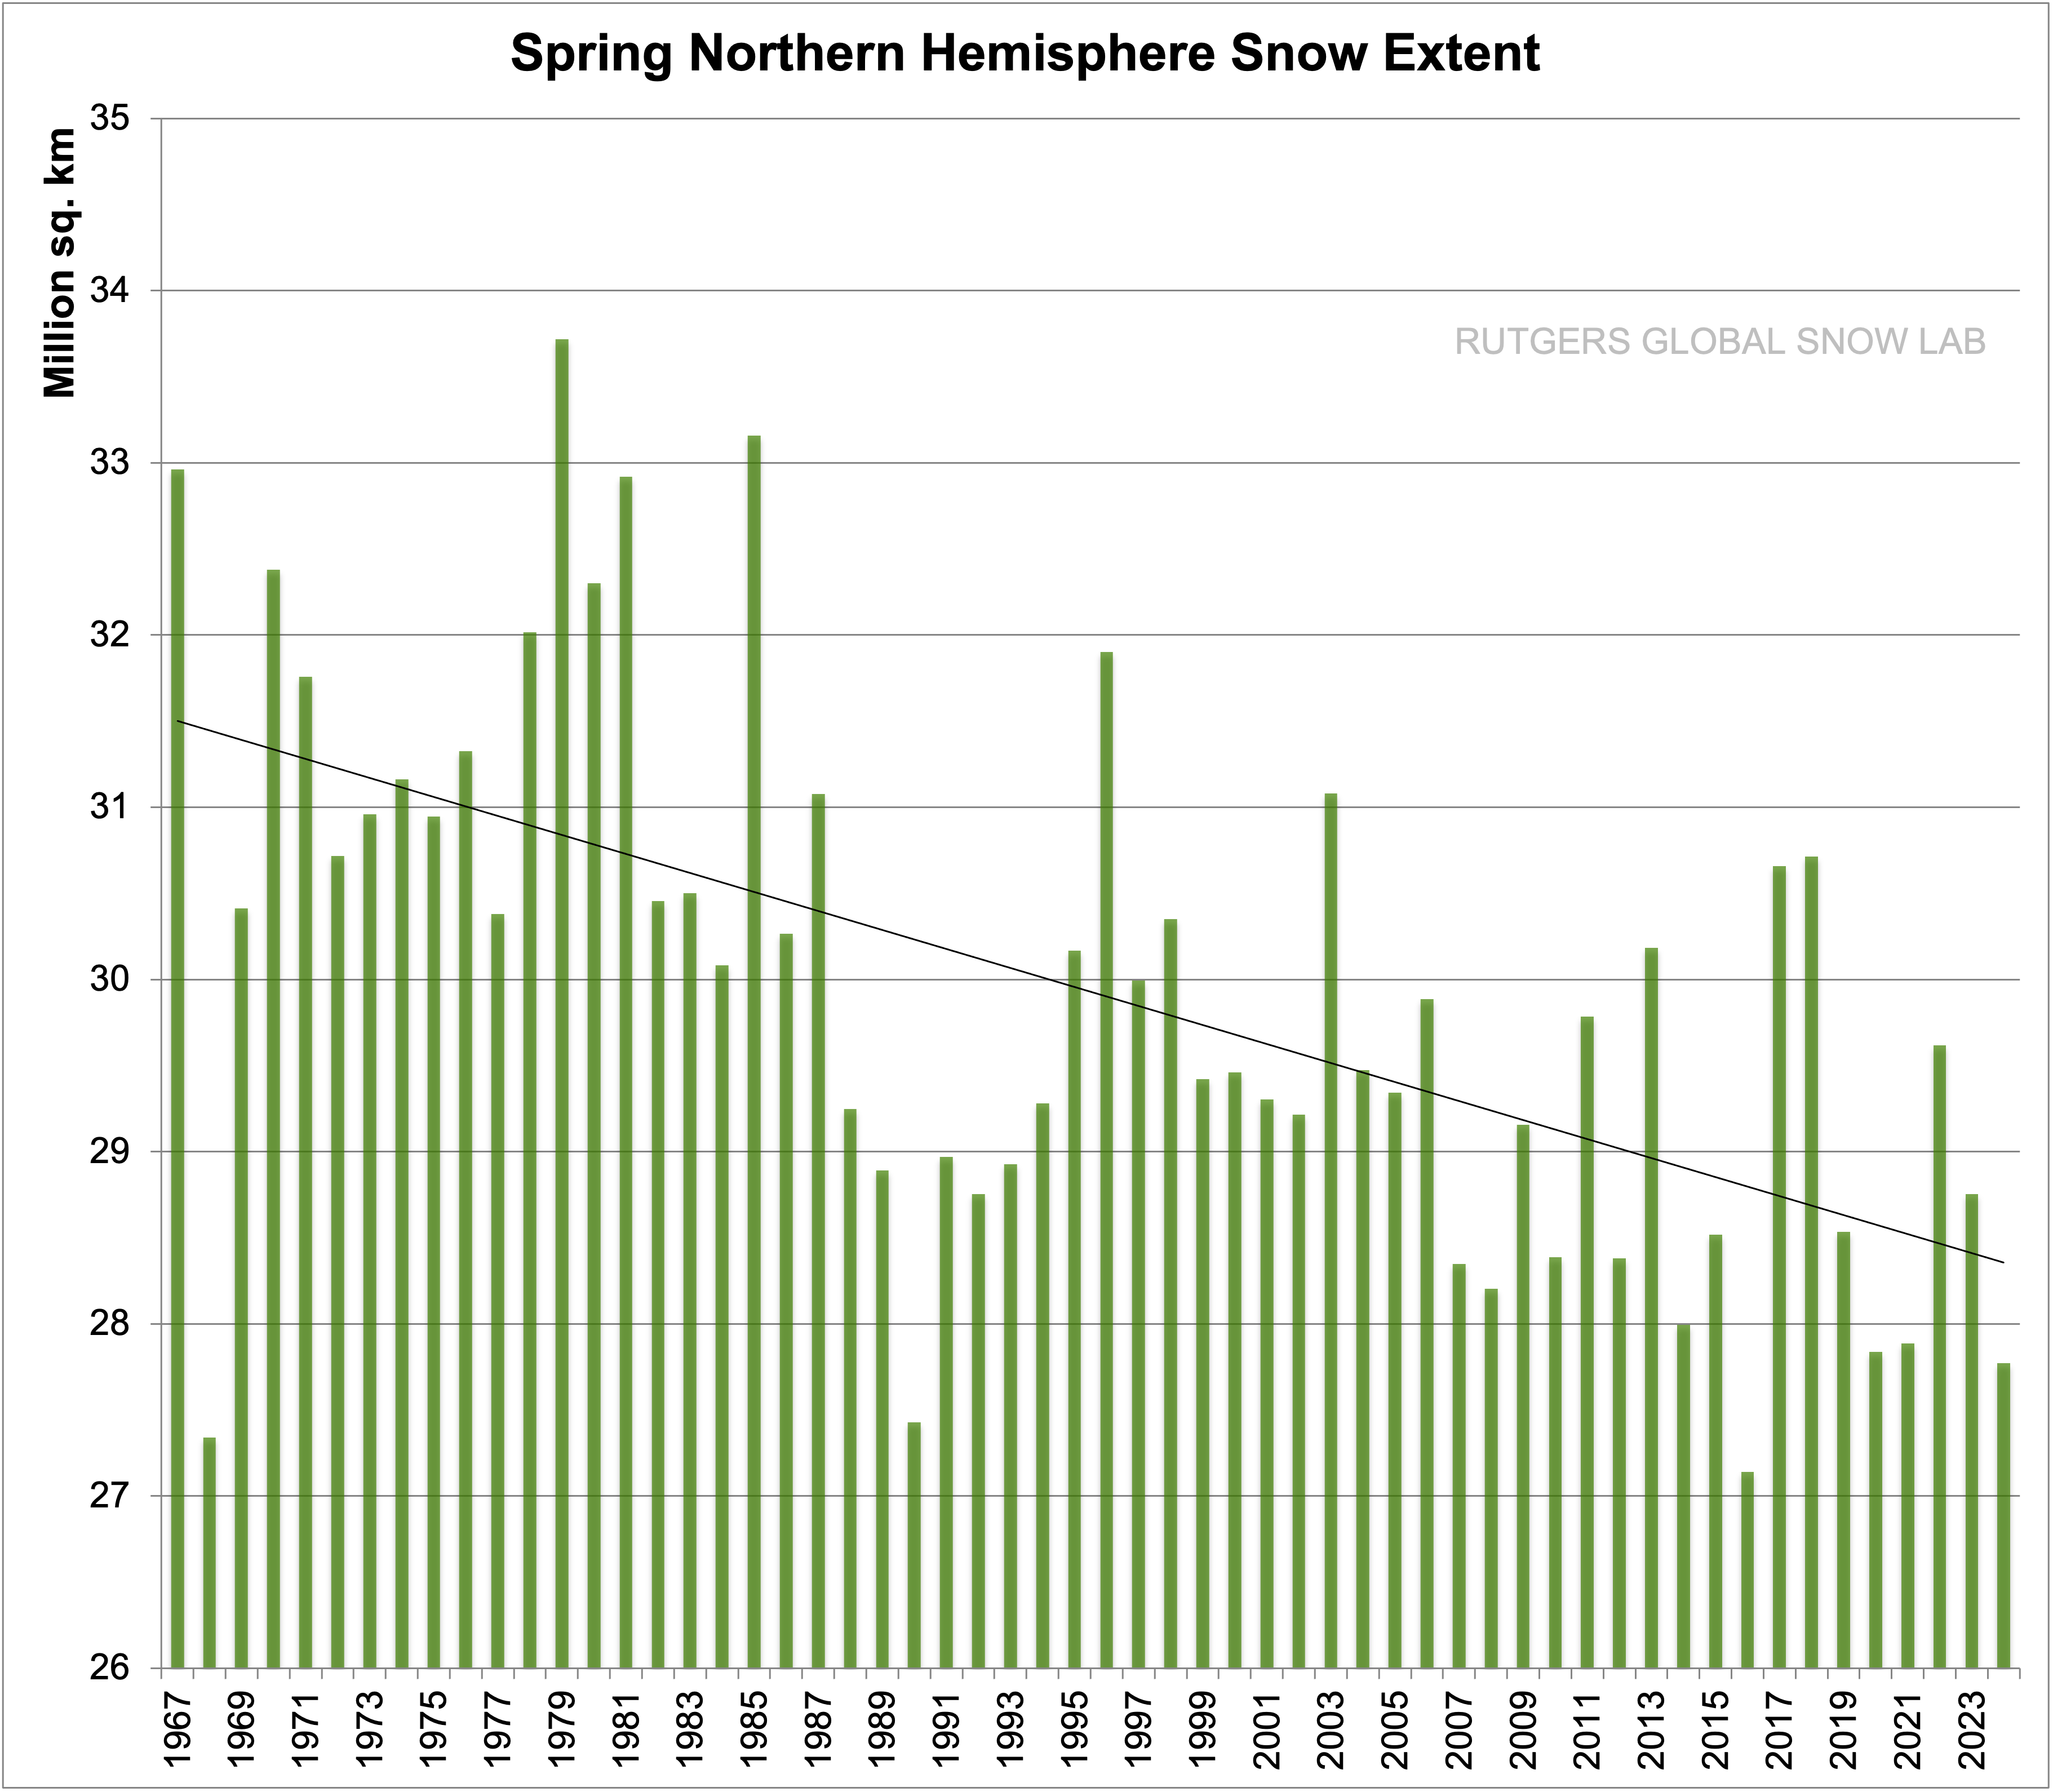
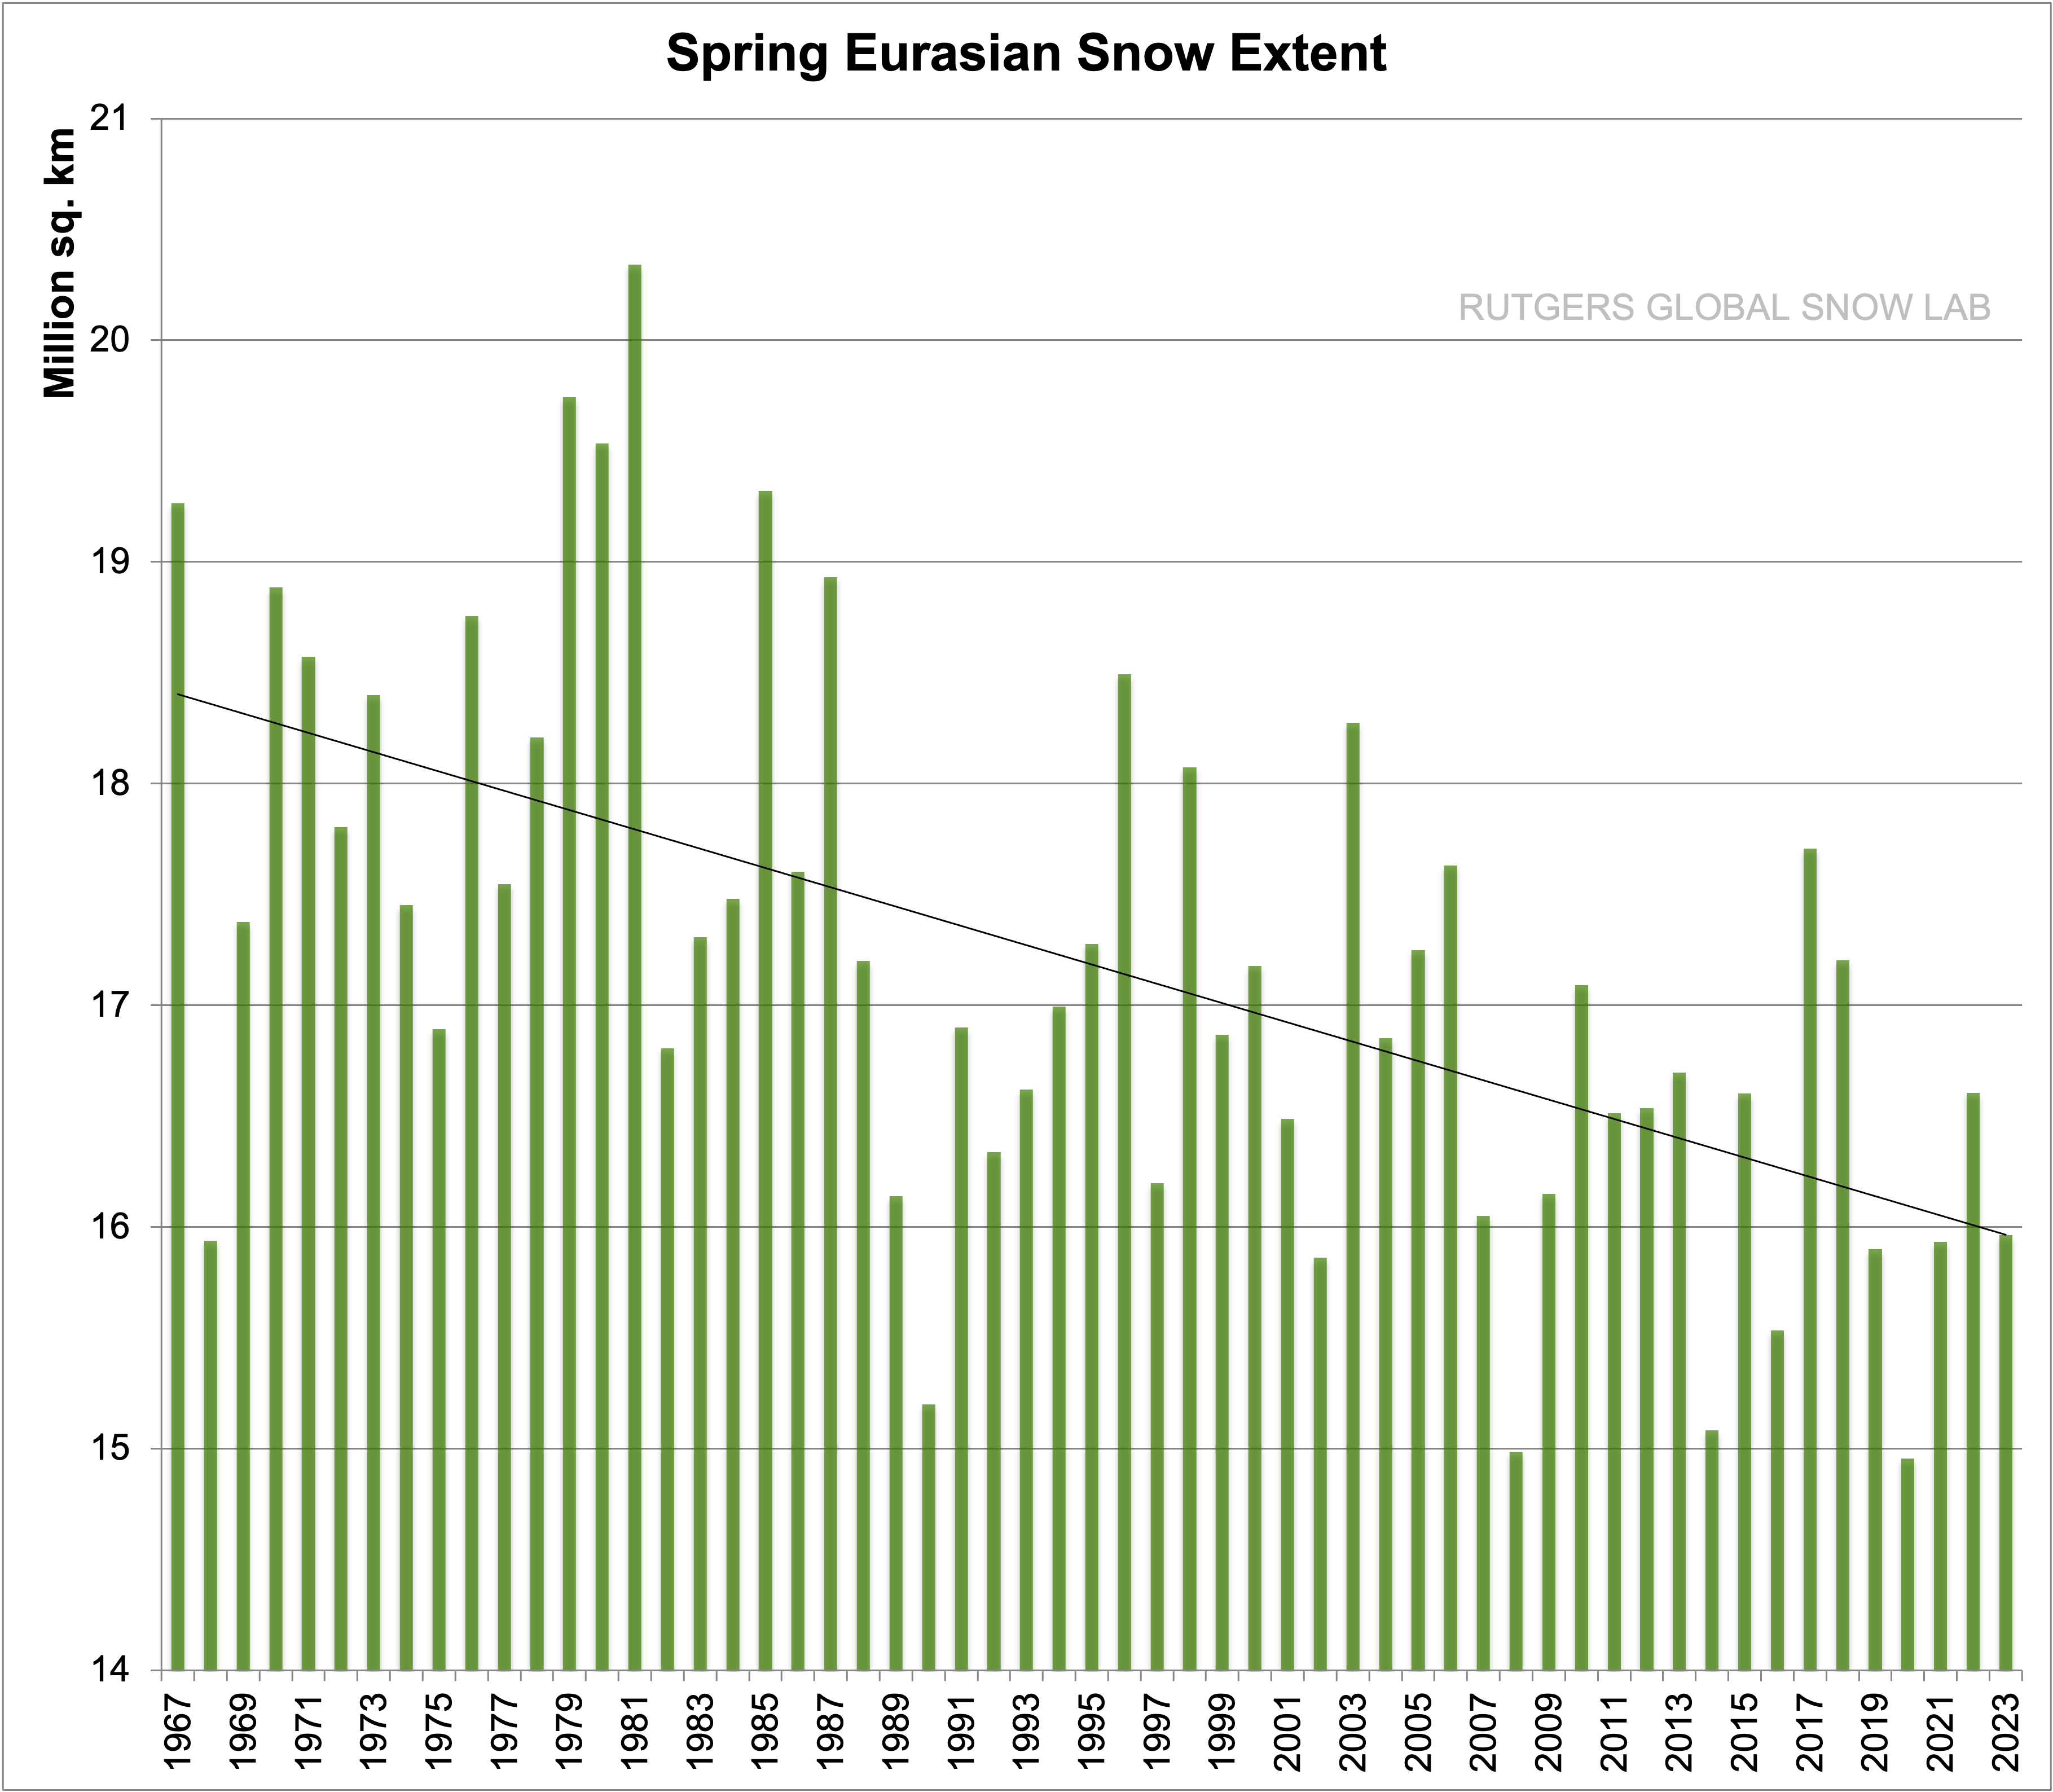
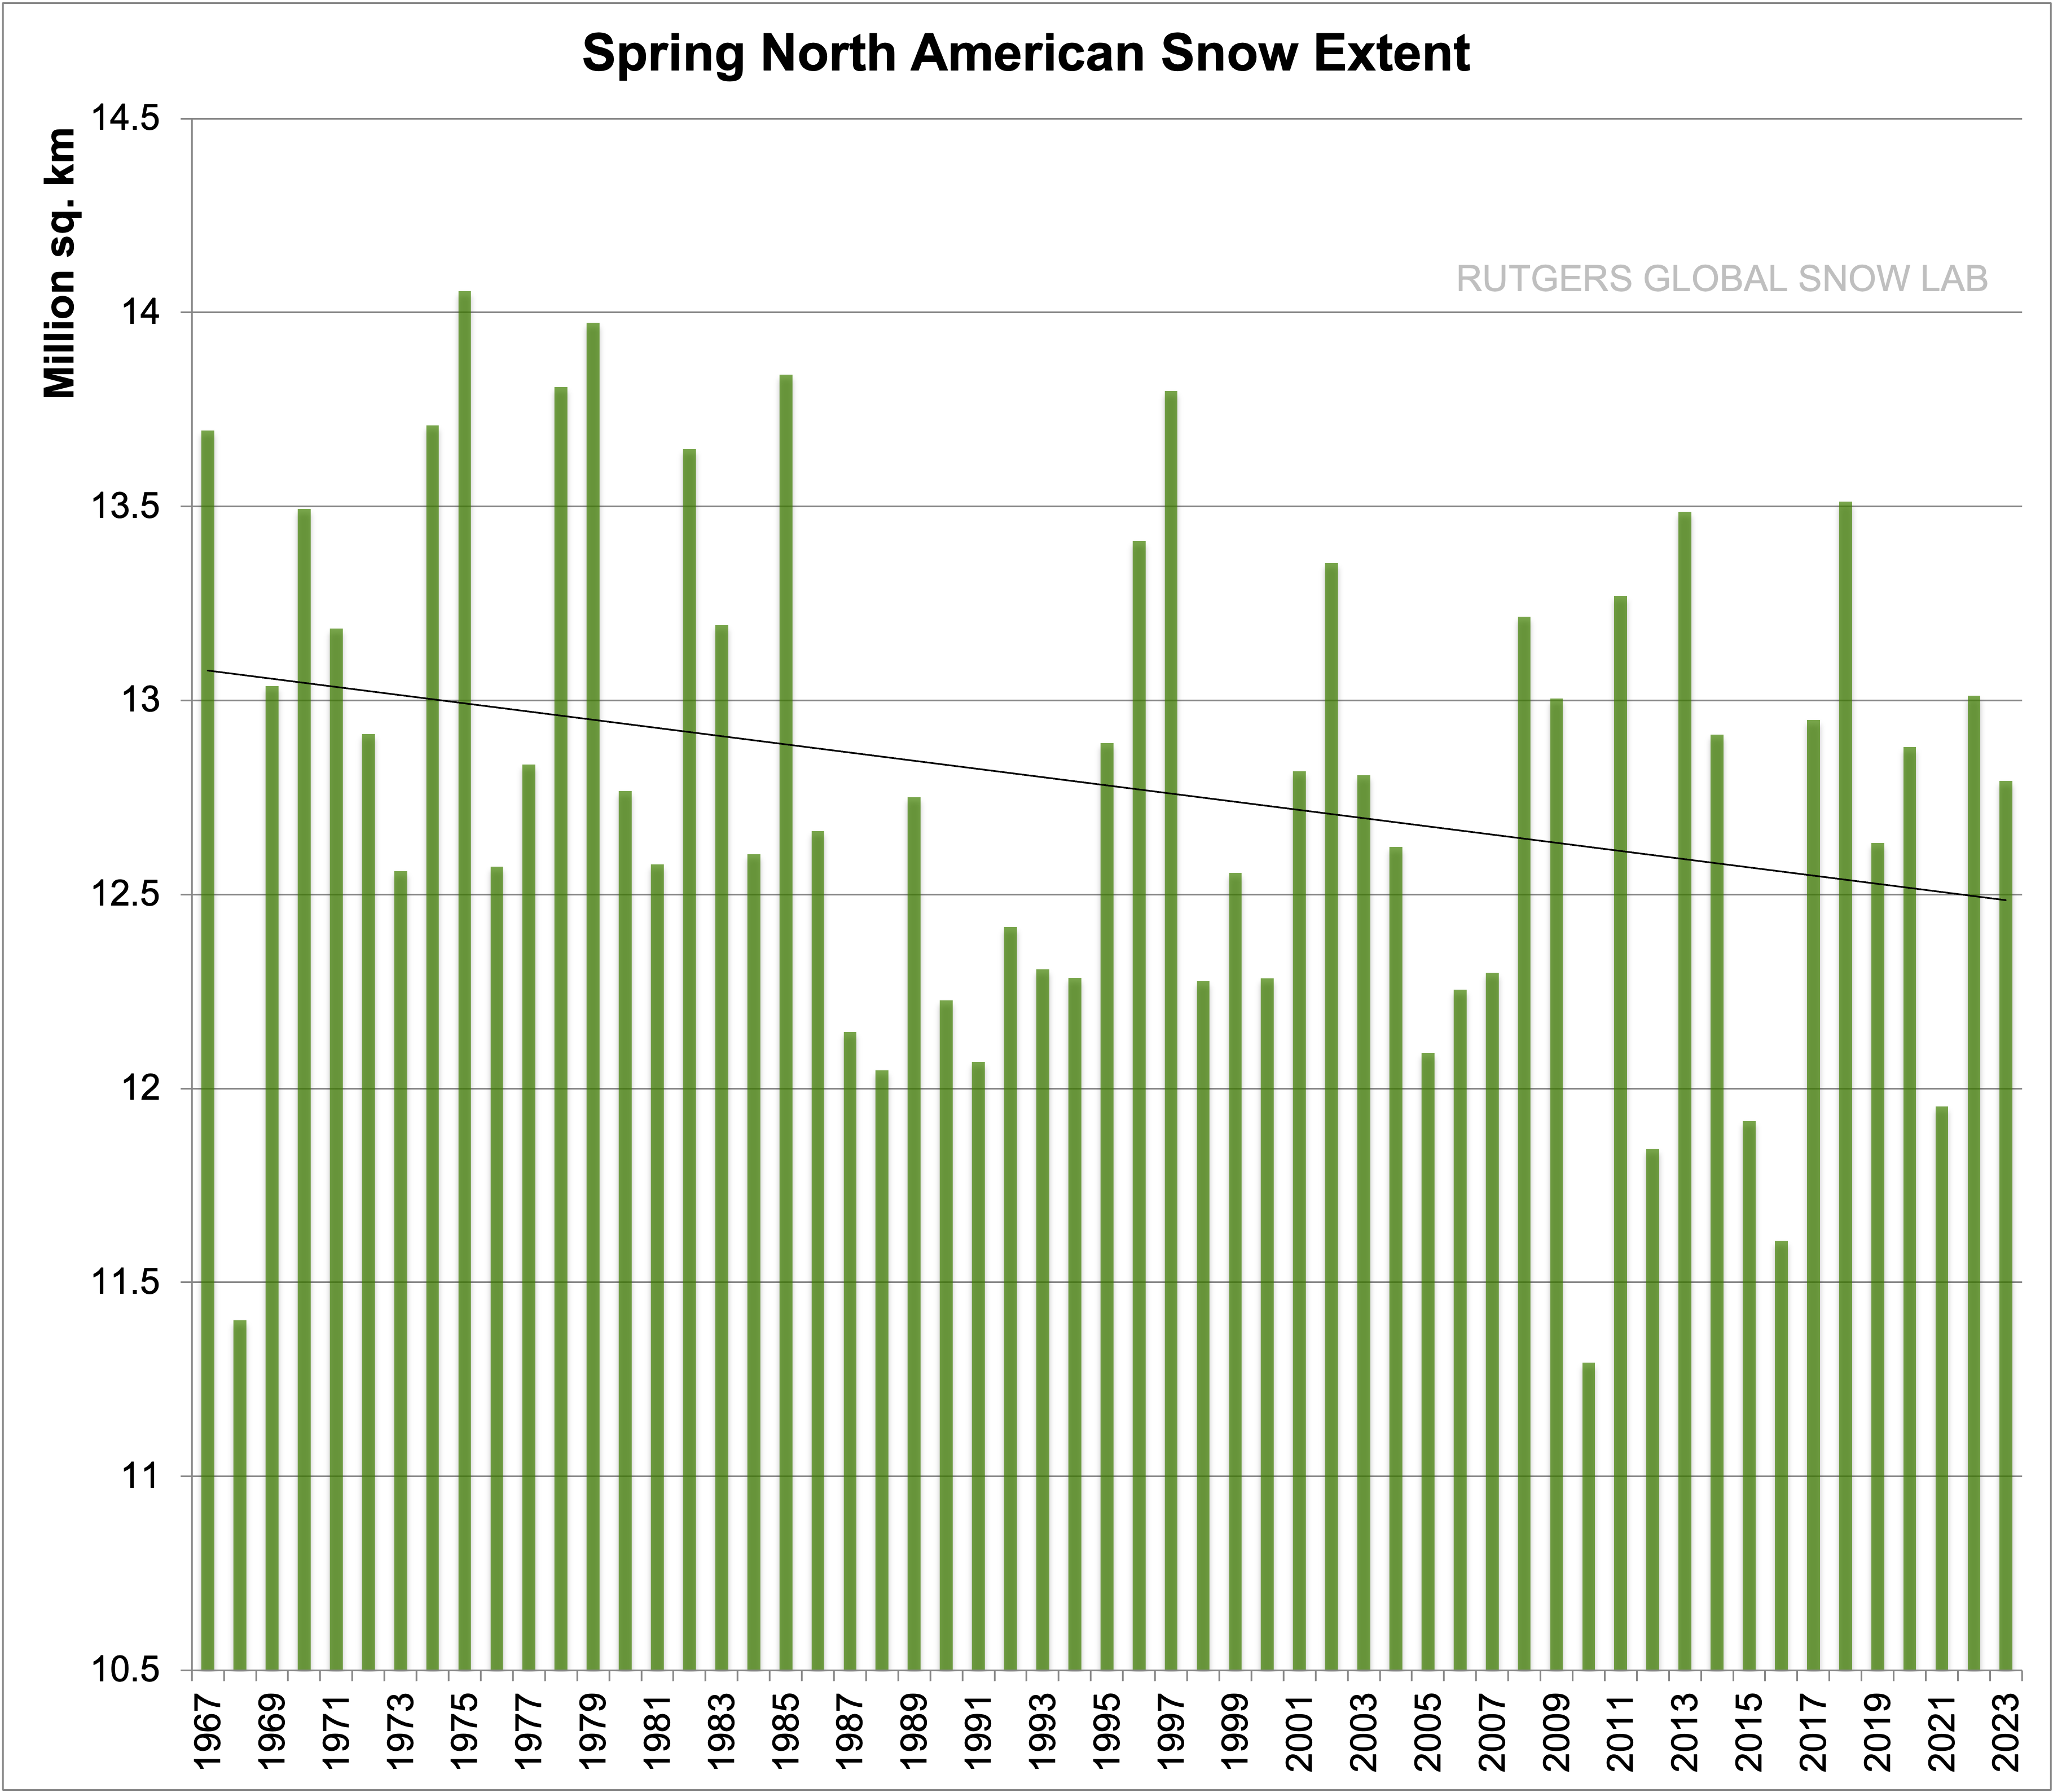
And here are the May and June graphs from Rutger's Snow Lab


Both show severe declines. The NH snow extent for November 2018 was the highest since 1966 but that is not what you are claiming. The rest of the year show small increases or no change. The sum, for the year, per the NSIDC, is a decline.
SOTC: Northern Hemisphere Snow | National Snow and Ice Data Center
Northern Hemisphere Snow
We all associate snowstorms with cold weather, but snow's influence on the weather and climate continues long after the storm ends. Because snow is highly reflective, a vast amount of sunlight that hits the snow is reflected back into space instead of warming the planet. Without snow cover, the ground absorbs about four to six times more of the Sun's energy. The presence or absence of snow controls patterns of heating and cooling over Earth's land surface more than any other single land surface feature.
In many locations in recent decades, temperatures have risen while precipitation levels have remained largely the same. Satellite data have confirmed that average snow cover has decreased, especially in the spring and summer. Where snow cover is disappearing earlier in the spring, the large amounts of energy that would have melted the snow can now directly warm the soil.
In terms of spatial extent, seasonal snow cover is the largest single component of the cryosphere and has a mean winter maximum areal extent of 47 million square kilometers, about 98 percent of which is located in the Northern Hemisphere.