Global Warming


which leads to>>>

How to Talk to a Climate Skeptic: Responses to the most common skeptical arguments on global warming

which leads to>>>

I have no intention of debating facts


and
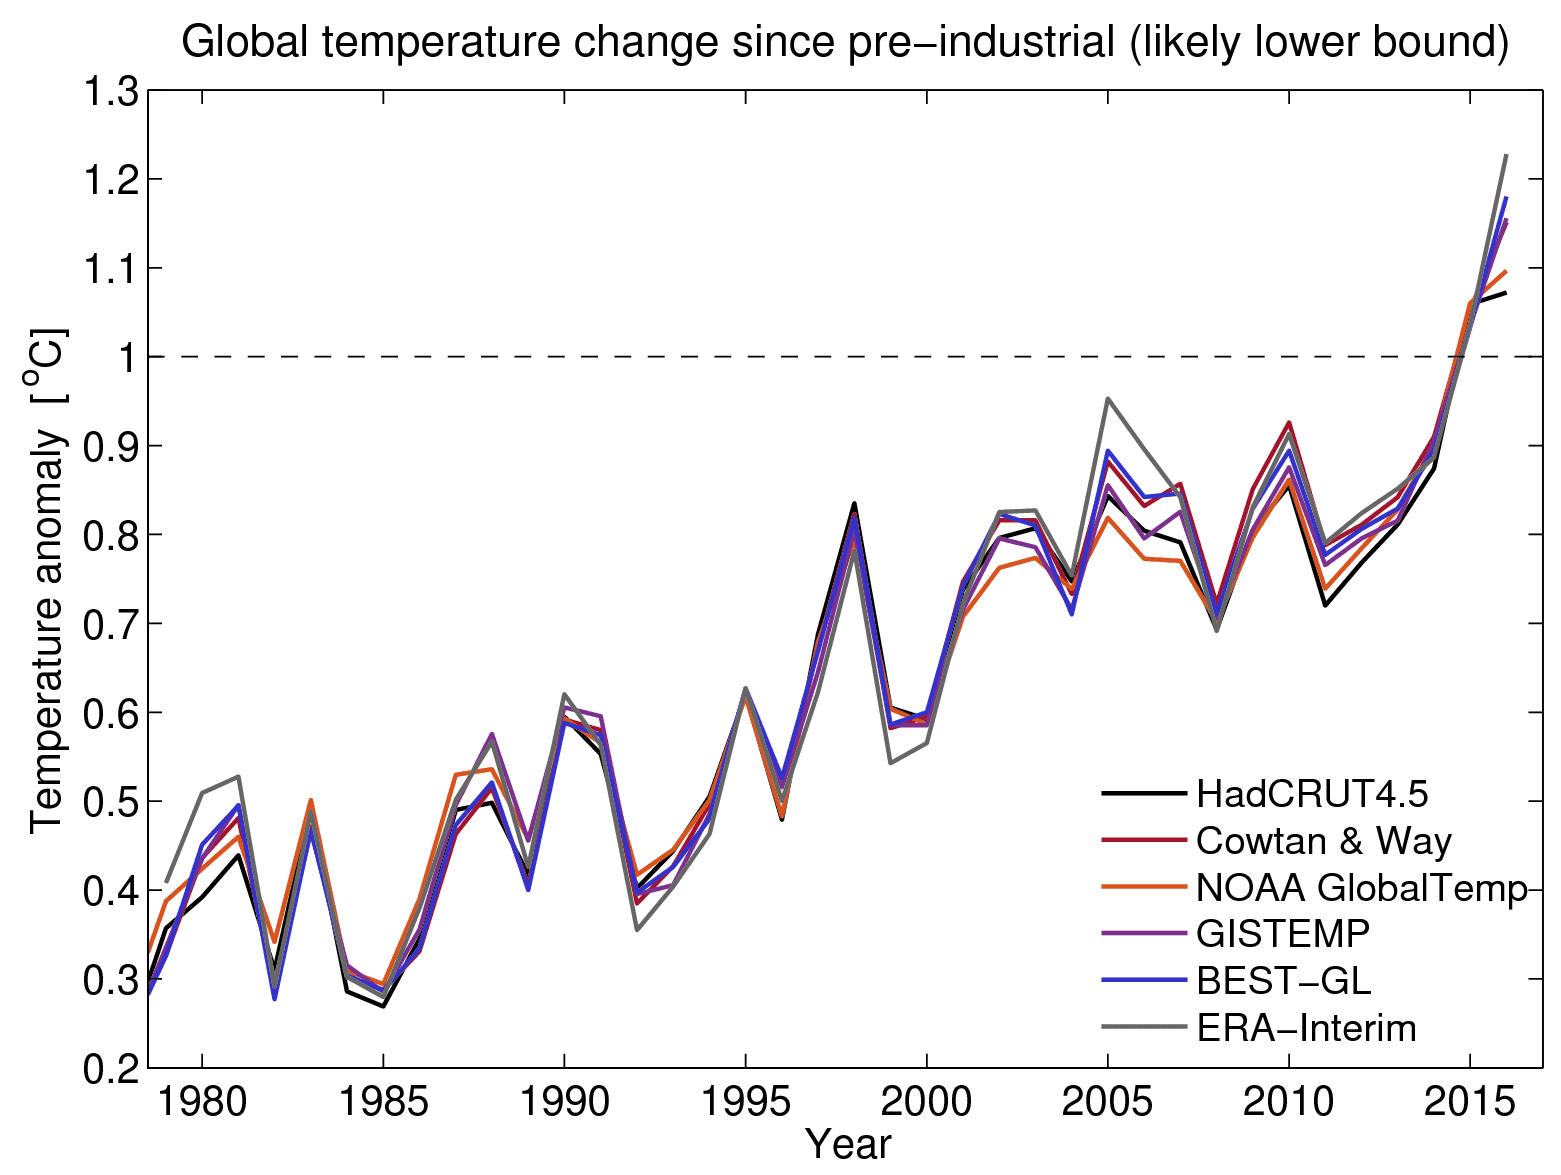
A strong consensus exists.

that can only be>>>

1975201_461800597284309_7035291477979682177_n.jpg


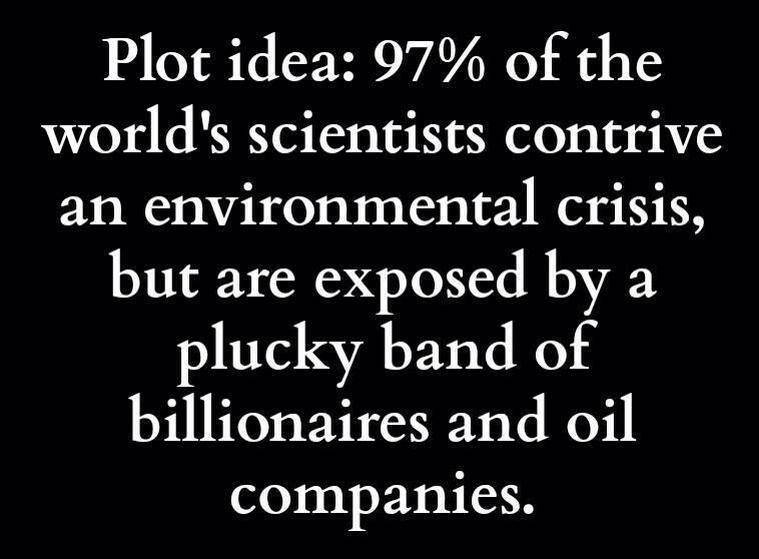
Translation~ nothing but non answers and excuses..I am part of the 97% yet you call us deniers why is that?


.
 
And so, SunSetTommy, what do you think these show? That the world isn't getting warmer?
 
And so, SunSetTommy, what do you think these show? That the world isn't getting warmer?

Stop being stupid on this since I have argued many time right here in the forum that it is warming but at a far lower rate than what the IPCC predicted/projected

Posted this several times already:

75 Papers Find Extremely Low CO2 Climate Sensitivity

By the way no answer to my charts at all...…………..
 
Last edited:
Wood for Trees? University of Alabama at Huntsville? This is Roy Spencer's bad satellite measurements of nothing but tropospheric temperature. How about some actual global data (ie, land and ocean) from some actual sources (NASA, GISS, Hadley, JWA, etc)?

preind_fig5_updated2016.png


Easily makes a 0.4C increase between 2000 and 2018, with SIX, different, independent datasets in very close agreement.
Karl Et Al adjusted bull shit... Fake...
 
The 2007 IPCC report says:

"For the next two decades, a warming of about 0.2°C per decade is projected for a range of SRES emission scenarios. Even if the concentrations of all greenhouse gases and aerosols had been kept constant at year 2000 levels, a further warming of about 0.1°C per decade would be expected."

So, they predict 0.2C per decade, and what was seen is 0.19C/decade. Like I said, spot-on.

A .30C per decade is projected.

No, that's just something you made up. The IPCC never made such a prediction.

Satellite data since 2001:

UAH, which has a known wild cooling bias. That's the primary reason why nobody in the science uses it.

The secondary reason nobody uses satellite data is that all satellite data is inferior data. Satellite data doesn't measure surface temperature. It measures microwave emissions from the mid-troposphere, then runs it through a model with all kinds of fudge factors, and that spits out a temperature.

In contrast, the surface temperature data sets use these remarkable inventions called "thermometers" to directly measure surface temperature.

Honest people choose the direct method to determine surface temperature. You choose the fudge-factor method. What does that say about you?

You have a problem with the IPCC apparently since here is what THEY said:

"For the next two decades, a warming of about 0.2°C per decade is projected for a range of SRES emission scenarios."

That is a .2C/decade PROJECTION based on a range of scenarios. They then go onto say even if there is no increase to year 2000 levels we can expect additional warming.

"Even if the concentrations of all greenhouse gases and aerosols had been kept constant at year 2000 levels, a further warming of about 0.1°C per decade would be expected."

bolding mine

They add another .1C/decade on top of the already projected .2C/decade, that adds up to .3C/decade. Surely you can see this easily now?

Satellites measure regions that ground based temperature stations never cover, such as the region where the mythical tropospheric "hot spot" resides, that nobody has been able to find.
 
I see that brainless doesn't realize that Satellite data are used in HadCrut4, GISStemp to make a GLOBAL temperature chart.

Here is the composite of UAH,RSS, GISStemp and HadCrut4.

from:2001


Below the .2C/decade rate., and well below the .3C/decade rate.

HadCRut4 global mean, still below the .2C/decade rate...….

from:2001
 
Last edited:
You have a problem with the IPCC apparently since here is what THEY said:

"For the next two decades, a warming of about 0.2°C per decade is projected for a range of SRES emission scenarios."

That is a .2C/decade PROJECTION based on a range of scenarios. They then go onto say even if there is no increase to year 2000 levels we can expect additional warming.

No, that's not what they said. You misread it.

"Even if the concentrations of all greenhouse gases and aerosols had been kept constant at year 2000 levels, a further warming of about 0.1°C per decade would be expected."

bolding mine.

They add another .1C/decade on top of the already projected .2C/decade, that adds up to .3C/decade. Surely you can see this easily now?

No, the 0.1C is "instead of", and not "added to". That's made very clear in the text following those two sentences. You did try to read it, right? No? You just _believed_, instead of checking for yourself.? Funny how that works.

Projections of Future Changes in Climate - AR4 WGI Summary for Policymakers

---
For the next two decades, a warming of about 0.2°C per decade is projected for a range of SRES emission scenarios. Even if the concentrations of all greenhouse gases and aerosols had been kept constant at year 2000 levels, a further warming of about 0.1°C per decade would be expected. {10.3, 10.7}

  • Since IPCC’s first report in 1990, assessed projections have suggested global average temperature increases between about 0.15°C and 0.3°C per decade for 1990 to 2005. This can now be compared with observed values of about 0.2°C per decade, strengthening confidence in near-term projections. {1.2, 3.2}
  • Model experiments show that even if all radiative forcing agents were held constant at year 2000 levels, a further warming trend would occur in the next two decades at a rate of about 0.1°C per decade, due mainly to the slow response of the oceans. About twice as much warming (0.2°C per decade) would be expected if emissions are within the range of the SRES scenarios. Best-estimate projections from models indicate that decadal average warming over each inhabited continent by 2030 is insensitive to the choice among SRES scenarios and is very likely to be at least twice as large as the corresponding model-estimated natural variability during the 20th century. {9.4, 10.3, 10.5, 11.211.7, Figure TS.29}
---

Bolding mine. It clearly shows the 0.1C is "instead of" and not "added to".

So, the IPCC predicted 0.2C, and 0.19C was observed. Spot on.

Satellites measure regions that ground based temperature stations never cover, such as the region where the mythical tropospheric "hot spot" resides, that nobody has been able to find.

You're just embarrassing yourself here. Satellites don't measure the polar areas, while ground stations do. And the hotspot is just fine. Stop relying on outdated denier conspiracy theories.
 
I see that brainless doesn't realize that Satellite data are used in HadCrut4, GISStemp to make a GLOBAL temperature chart.

No, that's absurd.

Here is the composite of UAH,RSS, GISStemp and HadCrut4.

"Composite" means all 4 measurements are averaged. It does not mean, as you claim, that some of the measurements depend on the others.

Below the .2C/decade rate., and well below the .3C/decade rate.

Yes, because it's got the wildly inaccurate UAH data mixed in.

HadCRut4 global mean, still below the .2C/decade rate...….

HadCRut leaves out the polar regions, which are warming faster, so it reads lower. The model predictions include polar regions. So, apples vs. oranges.
 
No, that's not what they said. You misread it.

"Even if the concentrations of all greenhouse gases and aerosols had been kept constant at year 2000 levels, a further warming of about 0.1°C per decade would be expected."

bolding mine.


So hairball, are you making the claim that so called greenhouse gasses are not increasing? Because that is what they are saying...that even if we were to stop generating more of them, and hold to the levels from 2000 we would still see warming of 0.1 degrees per decade.

Are CO2 levels the same now as they were in 2000? If not, then their predictions were off....and what is the margin of error for those predictions? And what is the margin of error for the actual average global temperature?


Sorry hairball, but climate pseudoscience is a great big fraud and only dupes believe what they have to say...the observed data contradict them at every turn.
 
So hairball,

Hey Pissgobbler, wassup?

are you making the claim that so called greenhouse gasses are not increasing? Because that is what they are saying...

No, it's not what they're saying. It's something you made up, and I can't figure out why. Your logic is not like our mere Earth logic.

that even if we were to stop generating more of them, and hold to the levels from 2000 we would still see warming of 0.1 degrees per decade.

Are CO2 levels the same now as they were in 2000? If not, then their predictions were off....

Even for you, that's stupid. CO2 levels are much higher than they were in 2000, hence the rate of warming is +0.2C/decade instead of +0.1C/decade. What about that confuses you?
 
Wood for Trees? University of Alabama at Huntsville? This is Roy Spencer's bad satellite measurements of nothing but tropospheric temperature. How about some actual global data (ie, land and ocean) from some actual sources (NASA, GISS, Hadley, JWA, etc)?

preind_fig5_updated2016.png


Easily makes a 0.4C increase between 2000 and 2018, with SIX, different, independent datasets in very close agreement.
Karl Et Al adjusted bull shit... Fake...

How about you show us someone with a real graduate degree in anything related to climate science that agrees with this, another in your endless string of unsubstantiated and easily refutable assertions. Do you EVER put up evidence? You claim to be a scientist of some sort but seem to have not the faintest idea how the scientific method works.
 

Forum List

Back
Top