ScienceRocks
Democrat all the way!
- Banned
- #1
Global Warming: the Relentless Trend
Posted on January 31, 2018 | 5 Comments
Global Warming: the Relentless Trend
Global warming is a fact that you better get use to!
Posted on January 31, 2018 | 5 Comments
When it comes to global warming, recent years have been so hot that it worries even those who deny the problem exists.
No one more desperately needs global warming to end than those most against doing anything about it. That’s why they cling so tight to the notion of a “pause” in global warming, a “pause” that was never more than a false impression, hoping others would believe the myth that it had all somehow stopped. Its death by thermometer has hit them hard.
Yet they can look forward to new pauses to come. The year 2016 was so hot it shattered the previous record by a country mile, boosted as it was by the temperature spike which always follows a powerful el Niño. That leap upward, the hot flash Earth feels after el Niño strikes, when combined with the steady upward climbing that is global warming, yielded a powerful new peak, a highest high born of the unholy marriage of extreme fluctuation and relentless trend. It may become their new delight, this highest peak, a cherry more ripe and juicy than any before it.
And cherry-pick they will. That’s what happened after the 1998 el Niño. Way back in 2006 Bob Carter announced “There is a problem with global warming… it stopped in 1998.” It was bullshit then, it’s bullshit now, but climate deniers have made the most out of what they do best: bullshit. Bob Carter made the most of the biggest confusion about global warming, because most people don’t fully understand what global warming is. It has nothing to do with the perpetual fluctuations.
Global warming is the relentless trend.
The new cherry is so very cherry, a set-up for a whole new “pause” whether it exists or not. Just be sure to start with the big spike near the beginning; when you put such an outburst so early it’s too easy to get, and to give, the wrong idea about the trend. That’s why James Hansen and others have pointed out in a recent report that upcoming temperature data could give just such a false impression.
Therefore, because of the combination of the strong 2016 El Niño and the phase of the solar cycle, it is plausible, if not likely, that the next 10 years of global temperature change will leave an impression of a ‘global warming hiatus’.
We have been warned.
And it has already begun. The pause is coming! Witness Larry Kummer suggest that a new pause may have started already, a “pause perhaps lasting 10 or 15 years,” complete with funny picture to suggest that the “pause that never was,” was. Contrary to the impression one might get from Kummer’s piece, Hansen et al. didn’t suggest that a “pause” or “hiatus” may be on the way, they say that the impression may be. The distinction is at the very heart of the matter.
Just how likely is it then, that recent hot years can create such a false impression? Let’s suppose — just for the sake of argument, mind you — that global warming didn’t pause and isn’t going to. Rather it has been rising at a steady pace while fluctuating up and down randomly, and will continue to do so. Given that there’s no “pause” past or present, just random fluctuation and relentless trend, what might the future bring, and might it give the “impression of a global warming hiatus”?
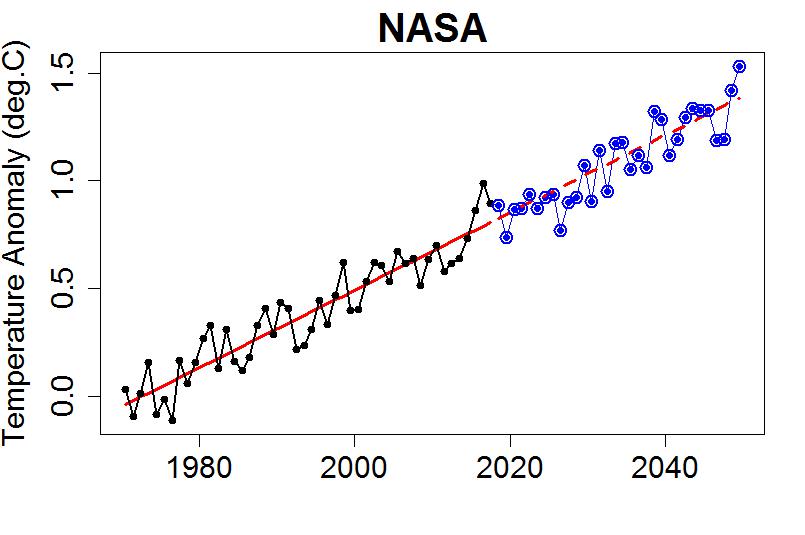
It’s easy to simulate what might happen. Start with global temperature data (from NASA), yearly averages since 1970. Estimate the trend mathematically (least squares regression). Extend that trend line into the future, say, until 2050. That’s what the relentless trend will do, just keep on keepin’ on.
The first thing we note is that the trend alone doesn’t surpass the record high of 2016 until the year 2027. If the data from now on follow the same relentless trend with no noise, then from 2016 through 2026 we’ll have 11 years without breaking the 2016 record. How long will it take for climate deniers to declare a “pause”?
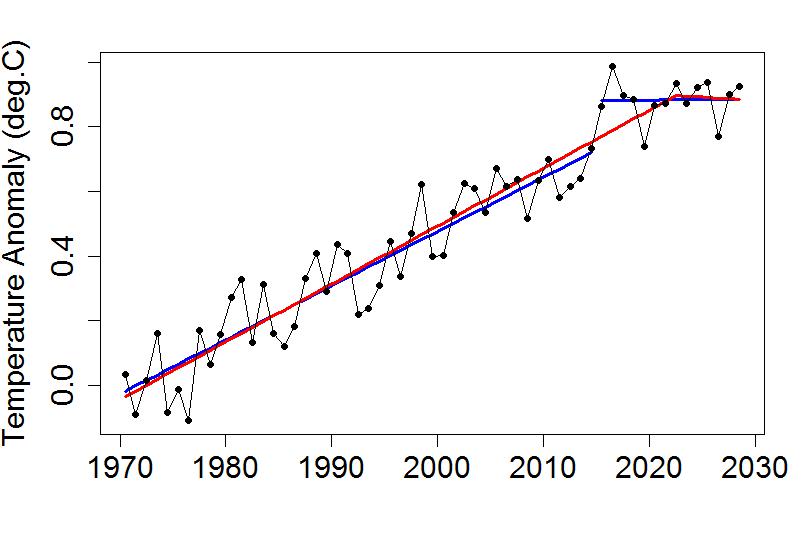
But we have no fluctuations to make the simulation realistic. So, use a random number generator to add simulated “noise” to the trend extension. Here’s one (the first one I got):
Could this give the “impression of a global warming hiatus”?
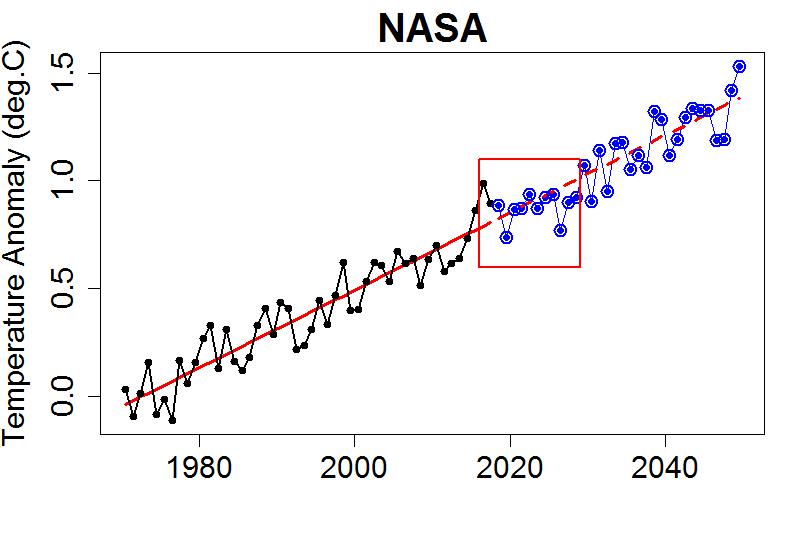
How about the 14-year period from 2016 through 2029?
It hasn’t yet exceeded the 2016 outburst; do you believe, even for a moment, that climate deniers will refrain from shouting “pause” — in spite of the fact that these data are the sum of random noise and that same relentless trend?
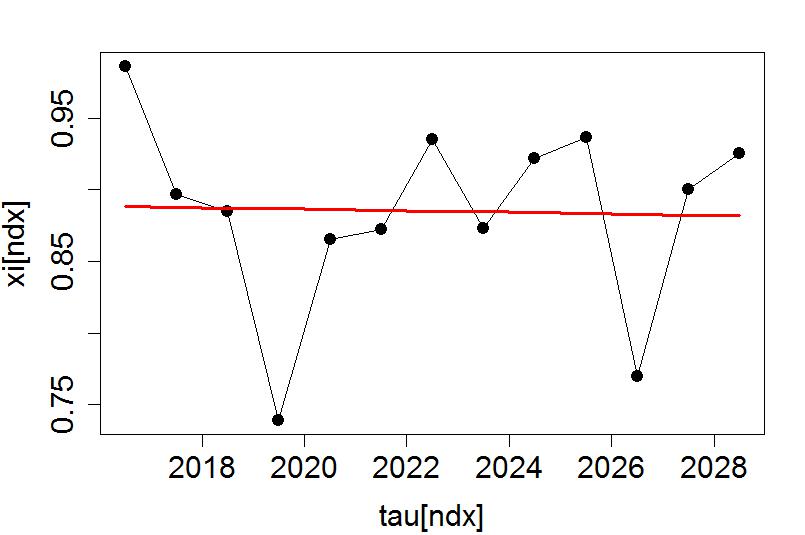
If I plot only that time span, even estimate a straight line trend (least squares again), I’d get this:
OMG! A fourteen-year streth with no trend at all! If anything, the globe is cooling!!! That’s what we’ll hear repeated over and over, In spite of the fact that these data are the sum of random noise and that same relentless trend. The impression of a pause is a combination of random chance with the fact that we started off with a big early peak.
Is it really just an impression? Set aside for the moment the fact that these are artificial data made of random fluctuations and relentless trend. Let’s try some valid statistical analysis:
The best-fit unbroken trend change only gives a naive p-value of 0.089, not enough to call statistically significant, and that’s without correcting for the multiple testing problem. But the best-fit broken trend, starting with 2015, gives a naive p-value of 0.011. Significant at almost 99% confidence? No. Multiple testing problem.
Monte Carlo simulations can tell us what the real p-value is for that broken trend, 0.18. Not even close. After all, it really is just random noise plus relentless trend.
Of course one simulation isn’t the whole story. So I ran 10,000 simulations.
Only 3% of them showed a below-zero trend for 14 years or more, so it turns out my first simulation was a bit extreme, but only a bit. Fully 14% shows a below-zero trend for 12 years or more, and 40% show a below-zero trend for 10 years or longer. A whopping 73% had a below-zero trend for 8 years or more; that is more than enough for climate deniers not only to claim “pause,” but to declare “proof” that global warming “stopped in 2016.”
As for long stretches since 2016 without a new record high, that too is surprisingly common given the “head start” of cherry-picking the big outburst. Fully 6% of simulations included a 12-year stretch without breaking the 2016 record, 20% had a 10-year stretch, and 43% of simulations included an 8-year stretch with no record-breaker … long enough for Bob Carter to claim that global warming stopped whether it did or not.
Global warming marches on, but as long as fluctuations happen (and they will happen) there will be plenty of room for climate deniers to say it showed a “pause.” Now that they have a new super-cherry to cherry-pick, they will deny reality no matter what the future brings. They will likely base it on exploiting the fluctuations, in spite of the fact they have nothing to do with man-made climate change. Global warming isn’t the fluctuations.
Global warming is the relentless trend.
Global Warming: the Relentless Trend
Global warming is a fact that you better get use to!