Global Warming Advocacy Science

westwall

WHEN GUNS ARE BANNED ONLY THE RICH WILL HAVE GUNS
Gold Supporting Member
Apr 21, 2010
96,518
57,621
2,605
Nevada
This is a very interesting research paper for the University of Pennsylvania Law School Institute for Law and Economics. It is a little long but the author J.S. Johnston (a professor and director of the environmental law program) does a good job of dissecting the IPCC and how it writes its reports.

He was surprised to find how the IPCC sytematically concealed or minimalized "fundamental scientific uncertainties" pertaining to climate change science.
He compared the reports to legal briefs which are anything but balanced and objective which is the mandate of the IPCC.


http://www.probeinternational.org/UPennCross.pdf
 
Last edited:
School of Law and Economics dissecting the IPCC report, eh. OK, so let's have the climate scientists disect the laws and economic policies of this nation. One is no less reasonable than the other.

The IPCC report is coming under fire from scientific sources, also. Seems that it was way to conservative. We are seeing things happening right now that were not supposed to happen until mid-century.


Hansen forecasted in 1988 that the 2000's where going to warm up near .23-.25c
, but we got about .15c, which he over forecasted it. It appears to be warming at near .15c per decade since 1990, which is clear, but 1998 was so outside this norm that it kind of killed the visual of it. The truth is if you think this stuff is good data at all and many think it's trash and shouldn't be trusted, but lets say for a second, westwall that in fact it's "GOOD" data, so that would mean we have a warming trend that now a normal year without nino should be as warm as 1983, 1984, 1987, 1992, which where nino's. So what was typical for a moderate to strong nino is being had with neutral conditions now.

Based on my calculations it should take to 2025-2030 time period for the avg to do that with 1998, 2005. Of course with all the cement warming the temperature of our world is more or less a who really knows, but we got satellites and more then one likely too that show the same...of course there was large cities in the early to mid part of the 20th century. Detroit was larger in the 1950s then it is today and New york was not much different...London? Sure, many area's have grown huge, but satellite shouldn't have this problem, right?

This signal is also within the Arctic ice data as a trend, but your going to get years above it and below it just like your going to do the same with yearly temperature...In the short term the -pdo should cause more years to be above it. So things are going to get cloudy. You forget that decade long patterns can cloud things and cause short term flatting or even the opposite with the trend. It would be amazing if the sea ice and global temperatures within the next 20 years with the -AMO and -pdo done what they did in the +Amo and +PDO phase...Looking at ENSO it would appear that a -PDO like what happened in the late 60's and through the 70's causes much stronger Nina's...The last 2-3 years could be a strong sign of what a negative PDO can do.

Which once again clouds the picture. My research into the last -pdo and -AMO shows about -.2 to -.25c downwards forcing. NOT nearly enough to erase even half of the warming we have seen the last 30 years, so the difference between the 1970's and 2010's and 2020's should be the difference or close to it of the real warming of our planet caused by what ever that is warming our planet outside of solar output and the AMO and PDO into the climate system. I think a useful way to compare global temperatures to the the 1990-2008 period is add about .2c on top of it once we're deep in the -Amo and -pdo by 2020. All this matters not one shitting thing if every data base of temperature has been fudged like our friends believe it to be. I kind of hope they didn't, but it is possible.

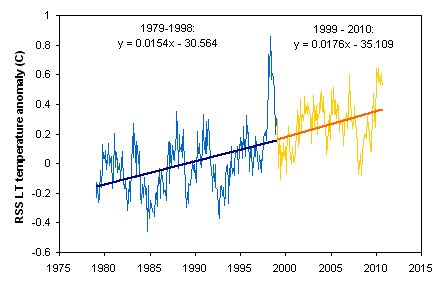
rss_before_after_1998.png


In fact this map shows .15 warming between 1990s, but increases to near .17c for 1999-2010. I also found that the solar minimum of the 1910's caused near -.1c of downward forcing...So if the temperature data hasn't been fudged fucked like our friends believe it has and global warming turns out to be true then we got to think of ways to compare it to a positive AMO and +PDO to understand the rate of change.

The -pdo like I said above favors more ice within the arctic.

I'm just saying just in case global warming turns out to be true...Who knows I'm quite confused mostly because the kind of evil that would lie to us in this way would be quite bad and may led to the third world war. Lets hope not.:eek:
 
Last edited:

Forum List

Back
Top