
DavidS
Anti-Tea Party Member
coaps.fsu.edu | Ryan Maue's Seasonal Tropical Cyclone Activity Update
Global and Northern Hemisphere Tropical Cyclone Activity [still] lowest in 30-years
Tropical cyclone (TC) activity worldwide has completely and utterly collapsed during the past 2 to 3 years with TC energy levels sinking to levels not seen since the late 1970s. This should not be a surprise to scientists since the natural variability in climate dominates any detectable or perceived global warming impact when it comes to measuring yearly integrated tropical cyclone activity. With the continuation (persistence) of colder Pacific tropical sea-surface temperatures associated with the effects of La Nina, the upcoming 2009 Atlantic hurricane season should be above average, as we saw in 2008. Nevertheless, since the Atlantic only makes up 10-15% of overall global TC activity each year (climatological average during the past 30 years), continued Northern Hemispheric and global TC inactivity as a whole likely will continue.
From Climate Audit guest blog posting Scroll down for more

As previously reported here and here at Climate Audit, and chronicled at my Florida State Global Hurricane Update page, both Northern Hemisphere and overall Global hurricane activity has continued to sink to levels not seen since the 1970s. Even more astounding, when the Southern Hemisphere hurricane data is analyzed to create a global value, we see that Global Hurricane Energy has sunk to 30-year lows, at the least. Since hurricane intensity and detection data is problematic as one goes back in time, when reporting and observing practices were different than today, it is possible that we underestimated global hurricane energy during the 1970s. See notes at bottom to avoid terminology discombobulation.
Using a well-accepted metric called the Accumulated Cyclone Energy index or ACE for short (Bell and Chelliah 2006), which has been used by Klotzbach (2006) and Emanuel (2005) (PDI is analogous to ACE), and most recently by myself in Maue (2009), simple analysis shows that 24-month running sums of global ACE or hurricane energy have plummeted to levels not seen in 30 years. Why use 24-month running sums instead of simply yearly values? Since a primary driver of the Earth's climate from year to year is the El Nino Southern Oscillation (ENSO) acts on time scales on the order of 2-7 years, and the fact that the bulk of the Southern Hemisphere hurricane season occurs from October - March, a reasonable interpretation of global hurricane activity requires a better metric than simply calendar year totals. The 24-month running sums is analogous to the idea of "what have you done for me lately".
During the past 6 months, extending back to October of 2008 when the Southern Hemisphere tropical season was gearing up, global ACE had crashed due to two consecutive years of well-below average Northern Hemisphere hurricane activity. To avoid confusion, I am not specifically addressing the North Atlantic, which was above normal in 2008 (in terms of ACE), but the hemisphere (and or globe) as a whole. The North Atlantic only represents a 1/10 to 1/8 of global hurricane energy output on average but deservedly so demands disproportionate media attention due to the devastating societal impacts of recent major hurricane landfalls.
[SIZE=+1] Why the record low ACE? [/SIZE]
During the past 2 years +, the Earth's climate has cooled under the effects of a dramatic La Nina episode. The Pacific Ocean basin typically sees much weaker hurricanes that indeed have shorter lifecycles and therefore -- less ACE . Conversely, due to well-researched upper-atmospheric flow (e.g. vertical shear) configurations favorable to Atlantic hurricane development and intensification, La Nina falls tend to favor very active seasons in the Atlantic (word of warning for 2009). This offsetting relationship, high in the Atlantic and low in the Pacific, is a topic of discussion in my GRL paper, which will be a separate topic in a future posting. Thus, the Western North Pacific (typhoons) tropical activity was well below normal in 2007 and 2008 (see table). Same for the Eastern North Pacific. The Southern Hemisphere, which includes the southern Indian Ocean from the coast of Mozambique across Madagascar to the coast of Australia, into the South Pacific and Coral Sea, saw below normal activity as well in 2008. Through March 12, 2009, the Southern Hemisphere ACE is about half of what's expected in a normal year, with a multitude of very weak, short-lived hurricanes. All of these numbers tell a very simple story: just as there are active periods of hurricane activity around the globe, there are inactive periods, and we are currently experiencing one of the most impressive inactive periods, now for almost 3 years.
[SIZE=+1]Bottom Line [/SIZE]
Under global warming scenarios, hurricane intensity is expected to increase (on the order of a few percent), but MANY questions remain as to how much, where, and when. This science is very far from settled. Indeed, Al Gore has dropped the related slide in his PowerPoint (btw, is he addicted to the Teleprompter as well?) Many papers have suggested that these changes are already occurring especially in the strongest of hurricanes, e.g. this and that and here, due to warming sea-surface temperatures (the methodology and data issues with each of these papers has been discussed here at CA, and will be even more in the coming months). The notion that the overall global hurricane energy or ACE has collapsed does not contradict the above papers but provides an additional, perhaps less publicized piece of the puzzle. Indeed, the very strong interannual variability of global hurricane ACE (energy) highly correlated to ENSO, suggests that the role of tropical cyclones in climate is modulated very strongly by the big movers and shakers in large-scale, global climate. The perceptible (and perhaps measurable) impact of global warming on hurricanes in today's climate is arguably a pittance compared to the reorganization and modulation of hurricane formation locations and preferred tracks/intensification corridors dominated by ENSO (and other natural climate factors). Moreover, our understanding of the complicated role of hurricanes with and role in climate is nebulous to be charitable. We must increase our understanding of the current climate's hurricane activity.
Background:
During the summer and fall of 2007, as the Atlantic hurricane season failed to live up to the hyperbolic prognostications of the seasonal hurricane forecasters, I noticed that the rest of the Northern Hemisphere hurricane basins, which include the Western/Central/Eastern Pacific and Northern Indian Oceans, was on pace to produce the lowest Accumulated Cyclone Energy or ACE since 1977. ACE is the convolution or combination of a storm's intensity and longevity. Put simply, a long-lived very powerful Category 3 hurricane may have more than 100 times the ACE of a weaker tropical storm that lasts for less than a day. Over a season or calendar year, all individual storm ACE is added up to produce the overall seasonal or yearly ACE. Detailed tables of previous monthly and yearly ACE are described below.
The table does not include the Northern Indian Ocean, which can be deduced as the portion of the Northern Hemisphere total not included in the three major basins. Nevertheless, 2007 saw the lowest ACE since 1977. 2008 continued the dramatic downturn in hurricane energy or ACE. The following stacked bar chart demonstrates the highly variable, from year-to-year behavior of Northern Hemisphere (NH) ACE. The smaller inset line graph plots the raw data and trend (or lack thereof). Thus, during the past 60 years, with the data at hand, Northern Hemisphere ACE undergoes significant interannual variability but exhibits no significant statistical trend.
So what to expect in 2009? Well, the last Northern Hemisphere storm was Typhoon Dolphin in middle December of 2008, and no ACE has been recorded so far. The Southern Hemisphere is below normal by just about any definition of storm activity (unless you have access to the Elias sports bureau statistic creativity department), and the season is quickly running out. With La Nina-like conditions in the Pacific, a persistence forecast of below average global cyclone activity seems like a very good bet. Now if only the Dow Jones index didn't correlate so well with the Global ACE lately...
Notes: Hurricane is the term for Tropical Cyclone specific to the North Atlantic, Gulf of Mexico, Caribbean Sea, and the Pacific Ocean from Hawaii eastward to the Mexican coast. Other names around the world include Typhoon, Cyclone, and Willy-Willy (Oz) but hurricane is used generically to avoid confusion. Accumulated Cyclone Energy or ACE:
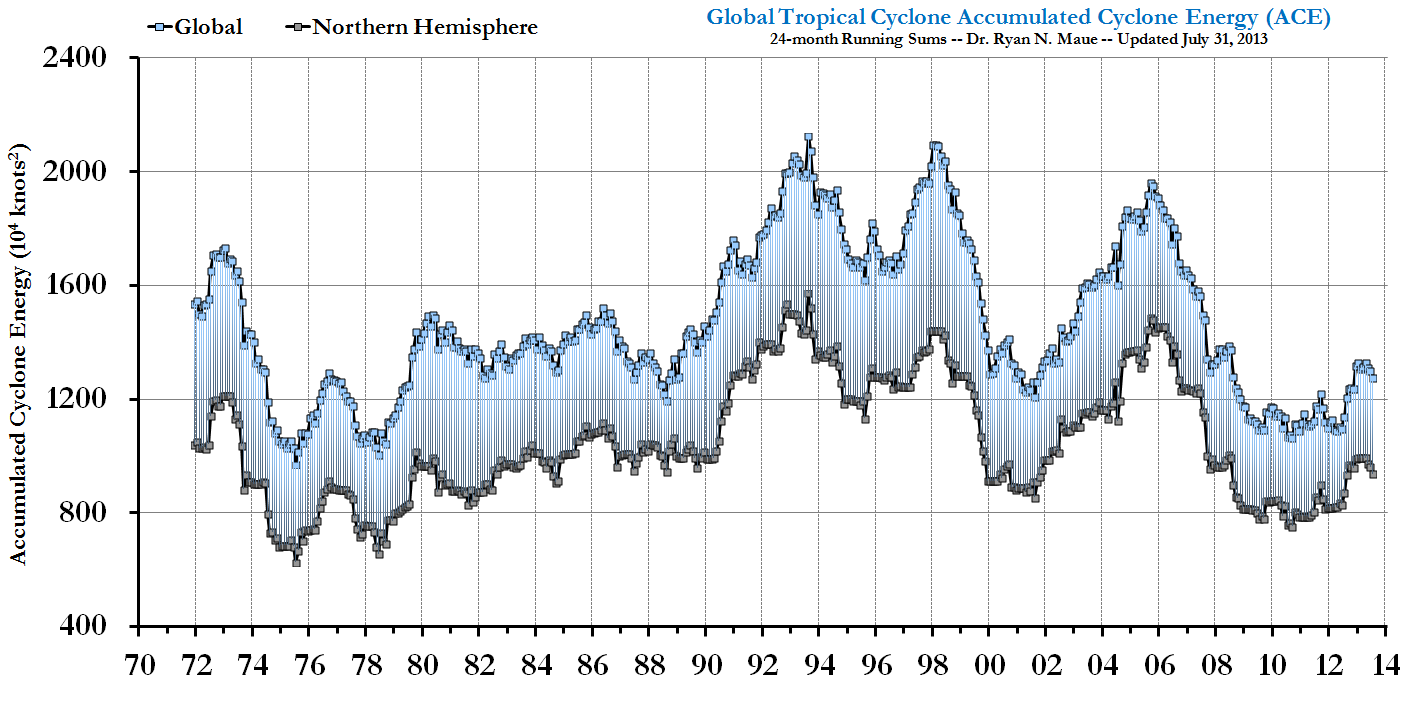
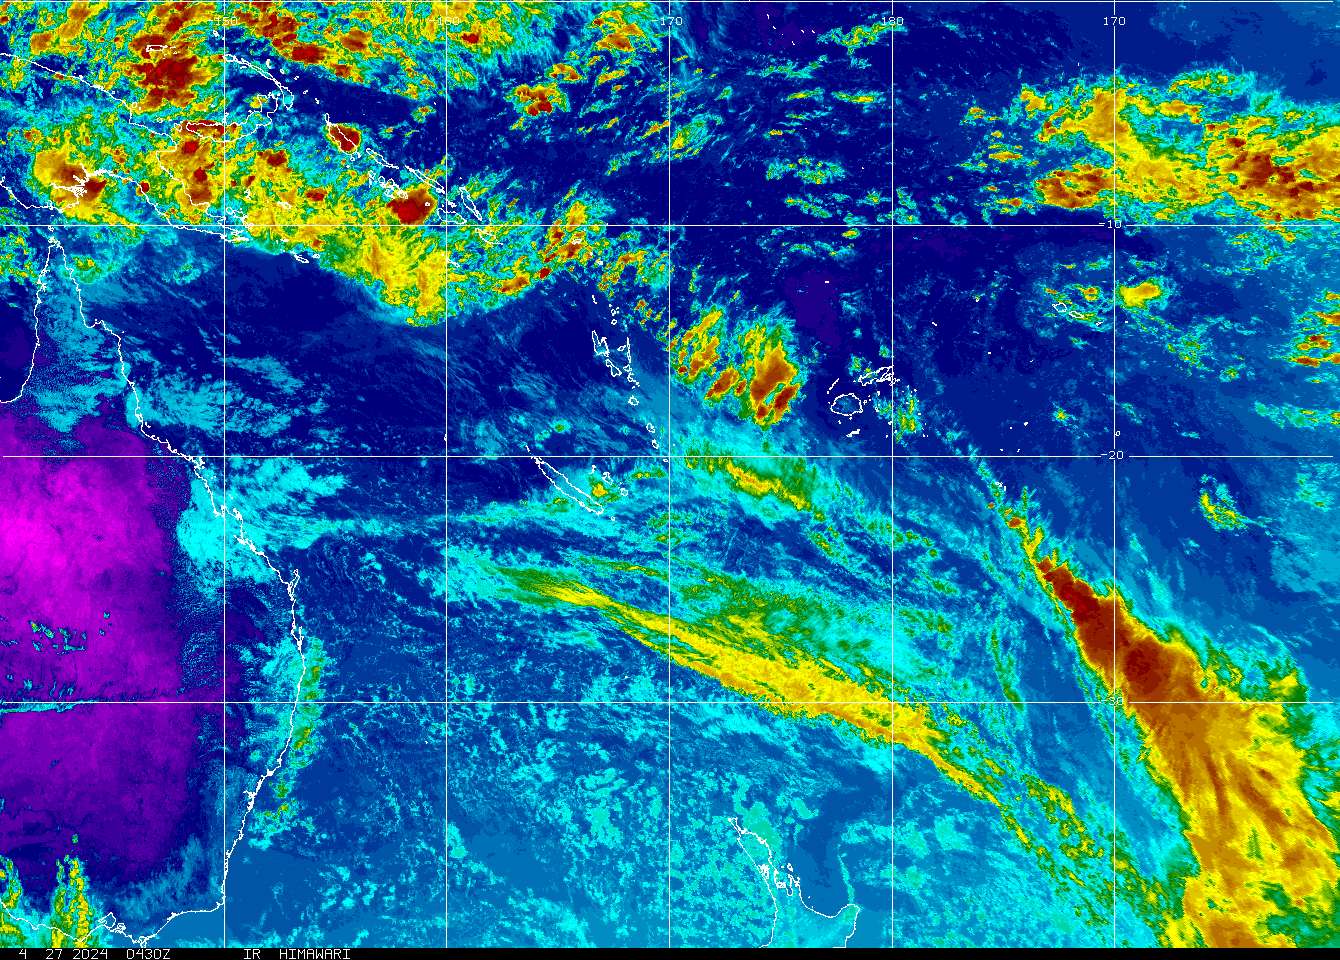
 is easily calculated from best-track hurricane datasets, with the one-minute maximum sustained wind squared and summed during the tropical lifecycle of a tropical storm or hurricane. [SIZE=+1]Global Infrared Satellite: Tropical Sectors [/SIZE]


[SIZE=+1]Global Tropical Cyclone ACE through Mar 12, 2009 12z[/SIZE]
BASIN 2009 ACE CLIMO YEARLY ACE* NORMAL TO DATE % of NORMAL Northern Hemisphere 0 557 4 - North Atlantic 0 104 0 - Western Pacific 0 280 3 - Eastern Pacific 0 156 0 - Southern Hemisphere 79.33 229 142+ 56%
* Climatological Values based upon 1982-2008 calendar year activity except for Southern Hemisphere.
+ Normal to date for Southern Hemisphere, 1981-2008 October-Februrary. Includes Southern Indian and Southern Pacific basins.
V max is maximum sustained 1-minute wind (knots) throughout the tropical lifecycle of each TC
[SIZE=+1]Previous Basin Activity[/SIZE]
BASIN 2005 ACE 2006 ACE 2007 ACE 2008 ACE 1982-2008 AVERAGE Northern Hemisphere 655 576 383 408 557 North Atlantic 243 83 72 142 104 Western Pacific 301 274 212 167 280 Eastern Pacific 97 204 55 83 156 Southern Hemisphere* 285 182 191 164 229
* Southern Hemisphere peak TC activity occurs between October and April. Thus, 2008 values represent the period October 2007 - April 2008.
Note: 1981-2008 March and April Southern Hemisphere ACE has averaged 84 with a standard deviation of 27, with a minimum of 47 in 1987 and maximum of 154 in 1992.
[SIZE=+2] Current Global TC Graphics [/SIZE]
Northern Hemisphere Hurricane Days & Global Major H Days -- 24 month running sum Excel Data File


Global and NH TC Accumulated Cyclone ACE -- 24 month running sum

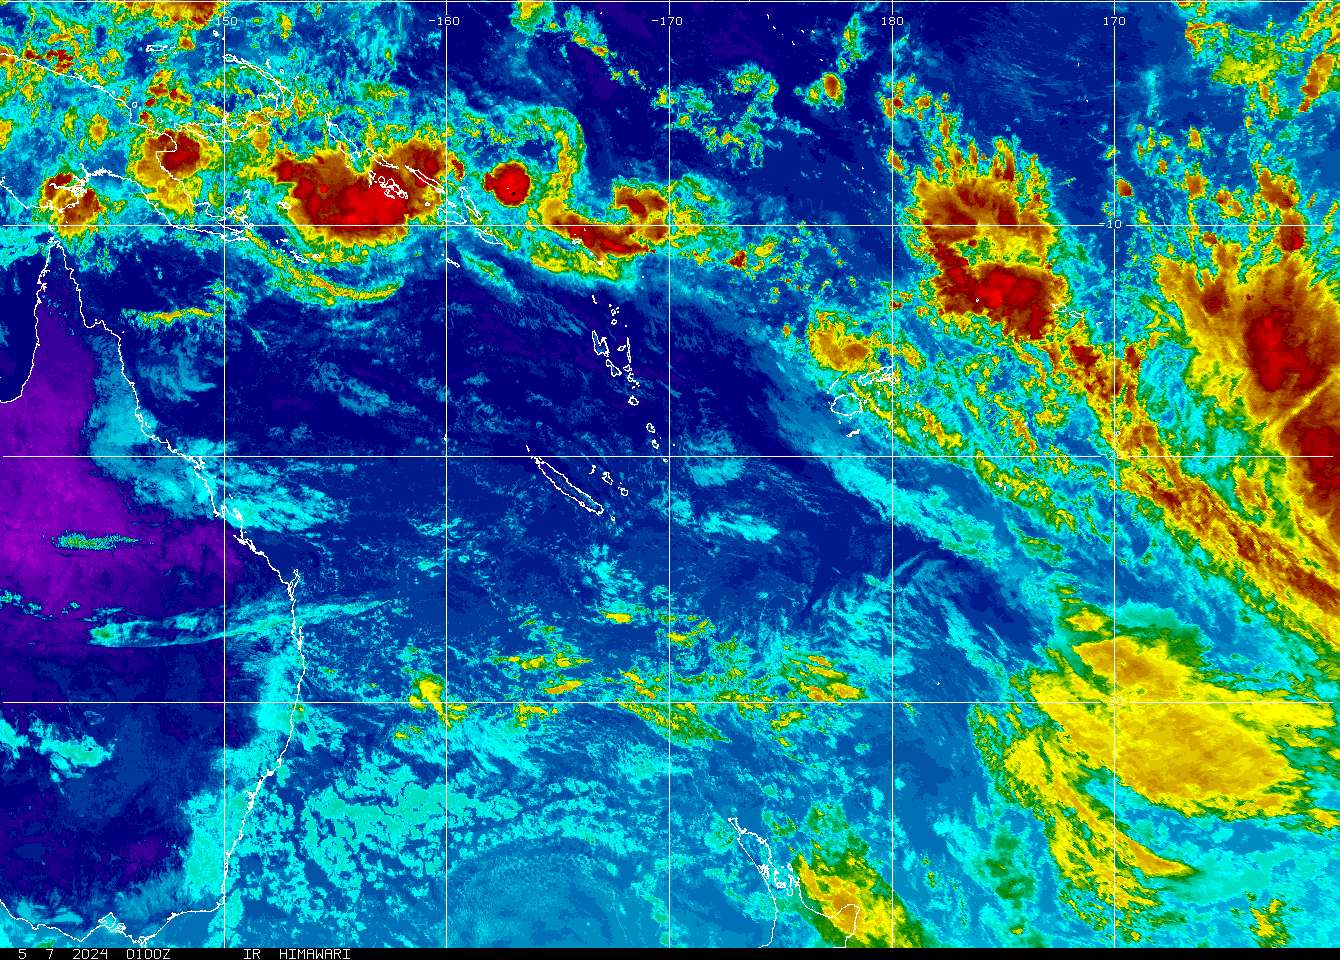
Analysis shown in the figure depicts tropical cyclone energy continuously summed over 24-month periods from 1973 through 28, February 2009. The top green time series shows the evolution of global Accumluated Cyclone Energy (ACE). Global ACE is at historical low levels -- the lowest in 30-years. The Earth is experiencing a prolonged period of severely depressed cyclone activity. The Northern Hemisphere is responsible for 70% of global tropical cyclone ACE on average since 1973. Thus, it is no surprise that Northern Hemisphere Tropical Cyclone activity is also at 30-year lows.
MONTH/YEAR NH ACE SH ACE NH HDAYS [INTENSE *] SH HDAYS [INTENSE *] GLOBAL 24-MONTH RUNNING ACE NH 24-MONTH RUNNING ACE JAN06 5.45 20.75 0 3 1863.0 1408.1 FEB06 15.41 42.91 0 9.25 [2] 1851.3 1407.9 MAR06 0.58 61.63 0 13.25 [4.75] 1840.8 1407.1 APR06 10.33 36.14 2.25 [1.25] 5.5 [3.25] 1850.4 1381.1 MAY06 25.27 0 6.75 [2.75] 0 1836.1 1369.2 JUN06 4.17 0 0 0 1763.6 1296.7 JUL06 101.15 0 22.25 [8] 0 1820.8 1353.9 AUG06 150.91 0 28 [13] 0 1796.5 1329.6 SEP06 166.45 0 44.75 [14.25] 0 1702.8 1237.9 OCT06 47.27 10.71 11.75 [1.25] 2.75 [1] 1688.8 1214.1 NOV06 39.71 4.89 8.75 [3.5] 1 1677.5 1227.2 DEC06 25.20 27.29 8.5 6.75 [3.25] 1690.7 1231.2 JAN07 0 17.6 0 3.25 1669.9 1225.8 FEB07 0 71.4 0 16.75 [4.75] 1655.4 1225.8 MAR07 0.13 46.3 0 10 [2.75] 1617.9 1222.2 APR07 8.0 12.7 2.25 2.5 [1.25] 1590.2 1217.5 MAY07 18.8 0.37 4 [2] 0 1606.2 1233.1 JUN07 21.7 0 3.5 [2] 0 1591.9 1218.8 JUL07 32.0 0 7 [2.25] 0 1522.0 1148.9 AUG07 108.3 0 21.75 [11.75] 0 1501.9 1128.8 SEP07 85.5 0 19.25 [4.75] 0 1363.2 990.1 OCT07 53.9 0 8.75 [4.25] 0 1317.1 944.6 NOV07 57.2 8.4 13.5 [3.25] 0.25 1344.1 982.5 DEC07 1.0275 15.6 0 2.5 [1] 1339.5 962.9 JAN08 0.3675 35.5 0 6.75 [1.75] 1349.2 957.8 FEB08 0 67.7 0 15 [5.25] 1374.0 957.8 MAR08 0 33.1 0 7.75 [2.5] 1344.9 957.3 APR08 15.59 3.33 5.5 0 1317.4 962.5 MAY08 45.6 0 10 [4.5] 0 1337.7 982.8 JUN08 20.1 0 5.25 0 1353.6 998.7 JUL08 81.14 0 20.75 [0.5] 0 1333.6 978.8 AUG08 49.5 0 10 [2.25] 0 1232.3 877.4 SEP08 130.45 0 26.75 [10.75] 0 1196.3 841.4 OCT08 42.085 4.645 9 [2.25] 0 1185.0 836.2 NOV08 16.0475 0.565 2.5 [1.25] 0 1157.0 812.5 DEC08 9.0825 16.25 2 3 [1.25] 1129.9 796.4 JAN09 0 10.1725 0 1.75 [0.25] 1122.4 796.4 FEB09 0 24.2925 0 4.5 [2] 1075.4 796.4 MAR09 0 23.405 0 4.75 [2.5] 1052.36 796.3 1979-2008 CLIMO - - - - 1570.4 1108.3
HDAYS are hurricane days [64 kts +]; Intense [96 kts+] or Category 3 and higher on the Saffir Simpson Scale
2009 Southern Hemisphere Operational Tracks Used in Table --> SH09_tracks
2008 Northern Hemisphere Tropical Cyclone Year in Review
Upon examination of all tropical cyclone activity in the basins throughout the Northern Hemisphere for the past 2 years, a remarkable downward trend in cyclone energy has continued and reached historic levels of inactivity.

USA Today Article on Northern Hemisphere Tropical Cyclone Inactivity
2007 Record Hemispheric Tropical Cyclone Inactivity
Global and Northern Hemisphere Tropical Cyclone Activity [still] lowest in 30-years
Tropical cyclone (TC) activity worldwide has completely and utterly collapsed during the past 2 to 3 years with TC energy levels sinking to levels not seen since the late 1970s. This should not be a surprise to scientists since the natural variability in climate dominates any detectable or perceived global warming impact when it comes to measuring yearly integrated tropical cyclone activity. With the continuation (persistence) of colder Pacific tropical sea-surface temperatures associated with the effects of La Nina, the upcoming 2009 Atlantic hurricane season should be above average, as we saw in 2008. Nevertheless, since the Atlantic only makes up 10-15% of overall global TC activity each year (climatological average during the past 30 years), continued Northern Hemispheric and global TC inactivity as a whole likely will continue.
From Climate Audit guest blog posting Scroll down for more
As previously reported here and here at Climate Audit, and chronicled at my Florida State Global Hurricane Update page, both Northern Hemisphere and overall Global hurricane activity has continued to sink to levels not seen since the 1970s. Even more astounding, when the Southern Hemisphere hurricane data is analyzed to create a global value, we see that Global Hurricane Energy has sunk to 30-year lows, at the least. Since hurricane intensity and detection data is problematic as one goes back in time, when reporting and observing practices were different than today, it is possible that we underestimated global hurricane energy during the 1970s. See notes at bottom to avoid terminology discombobulation.
Using a well-accepted metric called the Accumulated Cyclone Energy index or ACE for short (Bell and Chelliah 2006), which has been used by Klotzbach (2006) and Emanuel (2005) (PDI is analogous to ACE), and most recently by myself in Maue (2009), simple analysis shows that 24-month running sums of global ACE or hurricane energy have plummeted to levels not seen in 30 years. Why use 24-month running sums instead of simply yearly values? Since a primary driver of the Earth's climate from year to year is the El Nino Southern Oscillation (ENSO) acts on time scales on the order of 2-7 years, and the fact that the bulk of the Southern Hemisphere hurricane season occurs from October - March, a reasonable interpretation of global hurricane activity requires a better metric than simply calendar year totals. The 24-month running sums is analogous to the idea of "what have you done for me lately".
During the past 6 months, extending back to October of 2008 when the Southern Hemisphere tropical season was gearing up, global ACE had crashed due to two consecutive years of well-below average Northern Hemisphere hurricane activity. To avoid confusion, I am not specifically addressing the North Atlantic, which was above normal in 2008 (in terms of ACE), but the hemisphere (and or globe) as a whole. The North Atlantic only represents a 1/10 to 1/8 of global hurricane energy output on average but deservedly so demands disproportionate media attention due to the devastating societal impacts of recent major hurricane landfalls.
[SIZE=+1] Why the record low ACE? [/SIZE]
During the past 2 years +, the Earth's climate has cooled under the effects of a dramatic La Nina episode. The Pacific Ocean basin typically sees much weaker hurricanes that indeed have shorter lifecycles and therefore -- less ACE . Conversely, due to well-researched upper-atmospheric flow (e.g. vertical shear) configurations favorable to Atlantic hurricane development and intensification, La Nina falls tend to favor very active seasons in the Atlantic (word of warning for 2009). This offsetting relationship, high in the Atlantic and low in the Pacific, is a topic of discussion in my GRL paper, which will be a separate topic in a future posting. Thus, the Western North Pacific (typhoons) tropical activity was well below normal in 2007 and 2008 (see table). Same for the Eastern North Pacific. The Southern Hemisphere, which includes the southern Indian Ocean from the coast of Mozambique across Madagascar to the coast of Australia, into the South Pacific and Coral Sea, saw below normal activity as well in 2008. Through March 12, 2009, the Southern Hemisphere ACE is about half of what's expected in a normal year, with a multitude of very weak, short-lived hurricanes. All of these numbers tell a very simple story: just as there are active periods of hurricane activity around the globe, there are inactive periods, and we are currently experiencing one of the most impressive inactive periods, now for almost 3 years.
[SIZE=+1]Bottom Line [/SIZE]
Under global warming scenarios, hurricane intensity is expected to increase (on the order of a few percent), but MANY questions remain as to how much, where, and when. This science is very far from settled. Indeed, Al Gore has dropped the related slide in his PowerPoint (btw, is he addicted to the Teleprompter as well?) Many papers have suggested that these changes are already occurring especially in the strongest of hurricanes, e.g. this and that and here, due to warming sea-surface temperatures (the methodology and data issues with each of these papers has been discussed here at CA, and will be even more in the coming months). The notion that the overall global hurricane energy or ACE has collapsed does not contradict the above papers but provides an additional, perhaps less publicized piece of the puzzle. Indeed, the very strong interannual variability of global hurricane ACE (energy) highly correlated to ENSO, suggests that the role of tropical cyclones in climate is modulated very strongly by the big movers and shakers in large-scale, global climate. The perceptible (and perhaps measurable) impact of global warming on hurricanes in today's climate is arguably a pittance compared to the reorganization and modulation of hurricane formation locations and preferred tracks/intensification corridors dominated by ENSO (and other natural climate factors). Moreover, our understanding of the complicated role of hurricanes with and role in climate is nebulous to be charitable. We must increase our understanding of the current climate's hurricane activity.
Background:
During the summer and fall of 2007, as the Atlantic hurricane season failed to live up to the hyperbolic prognostications of the seasonal hurricane forecasters, I noticed that the rest of the Northern Hemisphere hurricane basins, which include the Western/Central/Eastern Pacific and Northern Indian Oceans, was on pace to produce the lowest Accumulated Cyclone Energy or ACE since 1977. ACE is the convolution or combination of a storm's intensity and longevity. Put simply, a long-lived very powerful Category 3 hurricane may have more than 100 times the ACE of a weaker tropical storm that lasts for less than a day. Over a season or calendar year, all individual storm ACE is added up to produce the overall seasonal or yearly ACE. Detailed tables of previous monthly and yearly ACE are described below.
The table does not include the Northern Indian Ocean, which can be deduced as the portion of the Northern Hemisphere total not included in the three major basins. Nevertheless, 2007 saw the lowest ACE since 1977. 2008 continued the dramatic downturn in hurricane energy or ACE. The following stacked bar chart demonstrates the highly variable, from year-to-year behavior of Northern Hemisphere (NH) ACE. The smaller inset line graph plots the raw data and trend (or lack thereof). Thus, during the past 60 years, with the data at hand, Northern Hemisphere ACE undergoes significant interannual variability but exhibits no significant statistical trend.

So what to expect in 2009? Well, the last Northern Hemisphere storm was Typhoon Dolphin in middle December of 2008, and no ACE has been recorded so far. The Southern Hemisphere is below normal by just about any definition of storm activity (unless you have access to the Elias sports bureau statistic creativity department), and the season is quickly running out. With La Nina-like conditions in the Pacific, a persistence forecast of below average global cyclone activity seems like a very good bet. Now if only the Dow Jones index didn't correlate so well with the Global ACE lately...
Notes: Hurricane is the term for Tropical Cyclone specific to the North Atlantic, Gulf of Mexico, Caribbean Sea, and the Pacific Ocean from Hawaii eastward to the Mexican coast. Other names around the world include Typhoon, Cyclone, and Willy-Willy (Oz) but hurricane is used generically to avoid confusion. Accumulated Cyclone Energy or ACE:


[SIZE=+1]Global Tropical Cyclone ACE through Mar 12, 2009 12z[/SIZE]
BASIN 2009 ACE CLIMO YEARLY ACE* NORMAL TO DATE % of NORMAL Northern Hemisphere 0 557 4 - North Atlantic 0 104 0 - Western Pacific 0 280 3 - Eastern Pacific 0 156 0 - Southern Hemisphere 79.33 229 142+ 56%
* Climatological Values based upon 1982-2008 calendar year activity except for Southern Hemisphere.
+ Normal to date for Southern Hemisphere, 1981-2008 October-Februrary. Includes Southern Indian and Southern Pacific basins.
V max is maximum sustained 1-minute wind (knots) throughout the tropical lifecycle of each TC [SIZE=+1]Previous Basin Activity[/SIZE]
BASIN 2005 ACE 2006 ACE 2007 ACE 2008 ACE 1982-2008 AVERAGE Northern Hemisphere 655 576 383 408 557 North Atlantic 243 83 72 142 104 Western Pacific 301 274 212 167 280 Eastern Pacific 97 204 55 83 156 Southern Hemisphere* 285 182 191 164 229
* Southern Hemisphere peak TC activity occurs between October and April. Thus, 2008 values represent the period October 2007 - April 2008.
Note: 1981-2008 March and April Southern Hemisphere ACE has averaged 84 with a standard deviation of 27, with a minimum of 47 in 1987 and maximum of 154 in 1992.
[SIZE=+2] Current Global TC Graphics [/SIZE]
Northern Hemisphere Hurricane Days & Global Major H Days -- 24 month running sum Excel Data File


Global and NH TC Accumulated Cyclone ACE -- 24 month running sum

Analysis shown in the figure depicts tropical cyclone energy continuously summed over 24-month periods from 1973 through 28, February 2009. The top green time series shows the evolution of global Accumluated Cyclone Energy (ACE). Global ACE is at historical low levels -- the lowest in 30-years. The Earth is experiencing a prolonged period of severely depressed cyclone activity. The Northern Hemisphere is responsible for 70% of global tropical cyclone ACE on average since 1973. Thus, it is no surprise that Northern Hemisphere Tropical Cyclone activity is also at 30-year lows.
MONTH/YEAR NH ACE SH ACE NH HDAYS [INTENSE *] SH HDAYS [INTENSE *] GLOBAL 24-MONTH RUNNING ACE NH 24-MONTH RUNNING ACE JAN06 5.45 20.75 0 3 1863.0 1408.1 FEB06 15.41 42.91 0 9.25 [2] 1851.3 1407.9 MAR06 0.58 61.63 0 13.25 [4.75] 1840.8 1407.1 APR06 10.33 36.14 2.25 [1.25] 5.5 [3.25] 1850.4 1381.1 MAY06 25.27 0 6.75 [2.75] 0 1836.1 1369.2 JUN06 4.17 0 0 0 1763.6 1296.7 JUL06 101.15 0 22.25 [8] 0 1820.8 1353.9 AUG06 150.91 0 28 [13] 0 1796.5 1329.6 SEP06 166.45 0 44.75 [14.25] 0 1702.8 1237.9 OCT06 47.27 10.71 11.75 [1.25] 2.75 [1] 1688.8 1214.1 NOV06 39.71 4.89 8.75 [3.5] 1 1677.5 1227.2 DEC06 25.20 27.29 8.5 6.75 [3.25] 1690.7 1231.2 JAN07 0 17.6 0 3.25 1669.9 1225.8 FEB07 0 71.4 0 16.75 [4.75] 1655.4 1225.8 MAR07 0.13 46.3 0 10 [2.75] 1617.9 1222.2 APR07 8.0 12.7 2.25 2.5 [1.25] 1590.2 1217.5 MAY07 18.8 0.37 4 [2] 0 1606.2 1233.1 JUN07 21.7 0 3.5 [2] 0 1591.9 1218.8 JUL07 32.0 0 7 [2.25] 0 1522.0 1148.9 AUG07 108.3 0 21.75 [11.75] 0 1501.9 1128.8 SEP07 85.5 0 19.25 [4.75] 0 1363.2 990.1 OCT07 53.9 0 8.75 [4.25] 0 1317.1 944.6 NOV07 57.2 8.4 13.5 [3.25] 0.25 1344.1 982.5 DEC07 1.0275 15.6 0 2.5 [1] 1339.5 962.9 JAN08 0.3675 35.5 0 6.75 [1.75] 1349.2 957.8 FEB08 0 67.7 0 15 [5.25] 1374.0 957.8 MAR08 0 33.1 0 7.75 [2.5] 1344.9 957.3 APR08 15.59 3.33 5.5 0 1317.4 962.5 MAY08 45.6 0 10 [4.5] 0 1337.7 982.8 JUN08 20.1 0 5.25 0 1353.6 998.7 JUL08 81.14 0 20.75 [0.5] 0 1333.6 978.8 AUG08 49.5 0 10 [2.25] 0 1232.3 877.4 SEP08 130.45 0 26.75 [10.75] 0 1196.3 841.4 OCT08 42.085 4.645 9 [2.25] 0 1185.0 836.2 NOV08 16.0475 0.565 2.5 [1.25] 0 1157.0 812.5 DEC08 9.0825 16.25 2 3 [1.25] 1129.9 796.4 JAN09 0 10.1725 0 1.75 [0.25] 1122.4 796.4 FEB09 0 24.2925 0 4.5 [2] 1075.4 796.4 MAR09 0 23.405 0 4.75 [2.5] 1052.36 796.3 1979-2008 CLIMO - - - - 1570.4 1108.3
HDAYS are hurricane days [64 kts +]; Intense [96 kts+] or Category 3 and higher on the Saffir Simpson Scale
2009 Southern Hemisphere Operational Tracks Used in Table --> SH09_tracks
2008 Northern Hemisphere Tropical Cyclone Year in Review
Upon examination of all tropical cyclone activity in the basins throughout the Northern Hemisphere for the past 2 years, a remarkable downward trend in cyclone energy has continued and reached historic levels of inactivity.

USA Today Article on Northern Hemisphere Tropical Cyclone Inactivity
2007 Record Hemispheric Tropical Cyclone Inactivity