- Oct 12, 2009
- 58,613
- 10,629
- 2,030
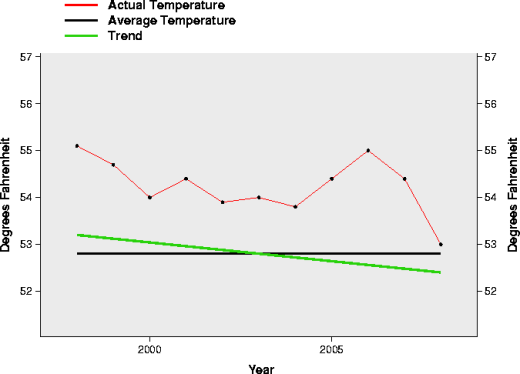
Here's the link to the chart:That chart is a lie in so many ways it isn't funny.
First of all the source of the graph is the "what's up with that" website.
Secondly, it is not a chart of the annual temps. According to the NCDC annual temp data 2005 was the warmest YEAR globally in the history of direct instrument measurement, and 2007 tied 1998 for the second warmest year, and every year after 2001 was warmer than 2001. Your chart, on the other hand shows 1998 as the warmest and 2006 as second warmest and 4 of the 7 years after 2001 as cooler than 2001.
And thirdly what you dishonestly did was take a chart for the month of DECEMBER only over that time period rather than a chart of the yearly temps.
This is why I say CON$ are the lowest PREMEDITATED lying scum that ever crawled out of a sewer.
Your statement in bold is a lie. The source is NOAA. The rest of your comments are pretty much the same. This warmest alarm you sound is for years which never exceeded a temperature of 1.5 degrees warmer than the AVERAGE temperature. Climate goes in cycles and this is certainly no radical shift as you would like us to believe. Go yell fire in someone else's movie theater.
http://wattsupwiththat.files.wordpress.com/2009/01/ncdc-december-2008.png?w=520&h=374
It's from the what's up with that website and its a chart of the month of December only, not yearly. Just click on it and read the title bar at the top of your browser window.
Again this is why no honest person has any respect for CON$. Even after you give them the truth, they just continue to lie while accusing the person who dares expose them to the truth of lying. Honest people have nothing but contempt for CON$.
Note the bold sentence above. The only way you know its a chart from December is by visiting the website. Where it is clearly labeled as a chart from a division of NOAA. The graph represents results very similiar to the annual results:
NOAA Climate Services
You have been caught in your deception.