Gergis 2012, new southern hemisphere hockey stick

http://static.stuff.co.nz/files/melbourne.pdf

is anybody interested in this paper? anyone following it? Old Rocks- it supports Mann, does that mean you are OK with it?

any warmers out there willing to discuss the methodologies used? hahahaha

If it says Co2 is bad, then the paper is wrong.

If it says CO2 is alright, then the paper is correct.

No need to read it, FOX has made up my mind for me already.
 
http://static.stuff.co.nz/files/melbourne.pdf

is anybody interested in this paper? anyone following it? Old Rocks- it supports Mann, does that mean you are OK with it?

any warmers out there willing to discuss the methodologies used? hahahaha
If it says Co2 is bad, then the paper is wrong.

If it says CO2 is alright, then the paper is correct.

No need to read it, FOX has made up my mind for me already.

its says-
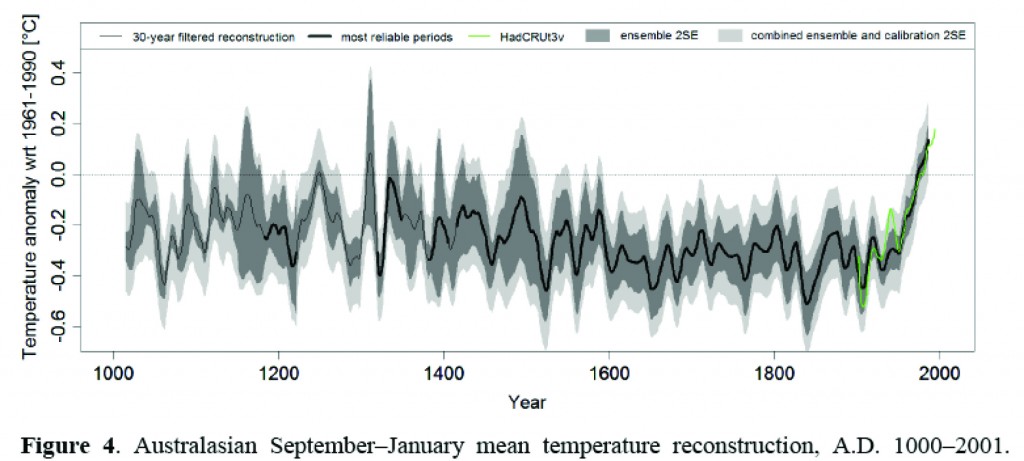
703 Our reconstruction suggests that peak pre-industrial warmth occurred in Australasia around A.D.
704 1240–1360, somewhat later than described from Northern Hemisphere regions. The maximum
temperature anomaly in the Australian region calculated over the A.D. 1238–1267 period is 0.09o705 C
706 (±0.19°C) below 1961–1990 levels. It is worth noting that this medieval warming occurred in the
707 absence of significant anthropogenic greenhouse gas emissions, thus is not analogous to post 1950
708 observed warming which is predominantly anthropogenically-forced (Karoly and Braganza, 2005;
709 Hegerl et al., 2007a). This implies that if the full range of natural climate variability has not yet
710 been observed in Australasia, anthropogenic forcing may led to future ‘climate surprises’ that may
711 manifest, for example, as changes in the frequency and duration of regional temperature extremes
712 (Alexander and Arblaster, 2009).

its hard to say whether that means good or bad, hahahaha. I suspect they want us to infer that it is bad.
 
I suspect they want us to infer that it is bad.

Perhaps they are just trying to communicate science.

perhaps. their methodology appears to be somewhat suspect. thats why I was hoping some warmist would post up links saying how wonderful this paper is, and how it already has a favoured spot in AR5.
 
What is suspect about it?


first and foremost is cherrypicking. Gergis stated that they used 27 out of 62 available proxy series and then proceeded to give the criteria for choosing the 27.

when asked to see the data for the unused proxies they refused.

when the proxy series that were chosen were put through the selection process by outside investigators, many of them failed to meet the criteria.

same old climate science story. cherrypick the data which best supports your preconceived conclusion, invent an ad hoc selection protocol that helps to cover your cherrypicking, then hide and obscure the data and methodologies so that your paper gets a good first impression that people remember before the whole thing get exposed as yet another fraud based on faulty science. these people have no shame.
 
from Climate Audit-

Jean S had observed:


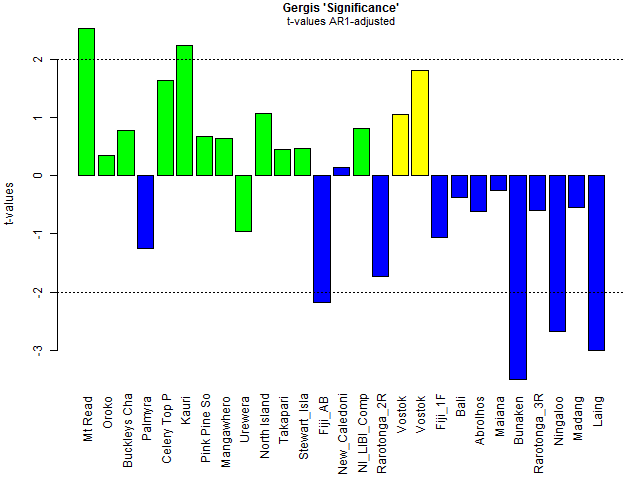
Steve, Roman, or somebody , what am I doing wrong here? I tried to check the screening correlations of Gergis et al, and I’m getting such low values for a few proxies that there is no way that those can pass any test. I understood from the text that they used correlation on period 1921-1990 after detrending (both the instrumental and proxies), and that the instrumental was the actual target series (and not the against individual grid series). Simple R-code and data here.

filehosting.org - download page for Gergis2012.zip

I’ve re-checked his results from scratch and can confirm them.

The following graphic shows t-values for a regression of each detrended “passing” proxy against the target instrumental series, all downloaded from original data. ( I got exactly the same correlations as Jean S.) These calculations calculate significance in the style of Santer et al 2008. (The AR1 coefficient of residuals of proxy~instrumental is calculated and the number of degrees of freedom adjusted. A two-sided 5% significance test (again in Santer style) has a t-value benchmark of about +-2 for series of the length of the calibration period. (It varies a little, but this is not material for the point here and t-values of +-2 are shown in the graphic.) Only six of the 27 proxies have t-values exceeding +-2.
gergis_t_values.png
 
RealClimate doesnt seem to have much to say-

First, a study by Gergis et al., in the Journal of Climate uses a proxy network from the Australasian region to reconstruct temperature over the last millennium, and finds what can only be described as an Australian hockey stick. They use an ensemble of 3000 different reconstructions, using different methods and different subsets of the proxy network. Worth noting is that while some tree rings are used (which can’t be avoided, as there simply aren’t any other data for some time periods), the reconstruction relies equally on coral records, which are not subject to the same potential (though often-overstated) issues at low frequencies. The conclusion reached is that summer temperatures in the post-1950 period were warmer than anything else in the last 1000 years at high confidence, and in the last ~400 years at very high confidence.
GergisFigure4-1024x461.jpg

from 22may12, nothing lately.
 
the IPCC report due out next year has already cites Gergis12-

IPCC AR5 (First Draft) cited Gergis et al as follows:


New paleo records from Australasia provide evidence of MCA warming around 1250–1330 CE, somewhat later than maximum medieval warmth described from many Northern Hemisphere regions (Gergis et al., submitted). Following peak medieval warmth in the early 1300s, a cooling trend reaching a temperature anomaly of approximately 0.5 ± 0.18°C below the 1961–1990 CE climatology during the peak of the LIA, 1830–1859 CE (Gergis et al., submitted).

In addition, the Gergis reconstruction was one of a number of regional reconstructions compared to model simulations.

they say there are new paleo records but all the proxies are old.
 
Last edited:
Basically they said that the four warmest decades in their series, which coverd only three of the decades, were, in this order, 2000 to 2010, 1990 to 2000, 1980 to 1990, and 1970 to 1980. Pretty much what has been observed worldwide.

As for the data they used, they stated their criteria, and, since the data is from other people, it is up to other researchers to request the data from the original sources, not from the people that wrote this paper.

Good Old loyal Rocks. are you not the teensiest bit interested in why many of the incorporated proxies dont seem to actually pass the criteria for inclusion?

realistic(k)ally just about any proxy series with instrumental temps added to the end will be hockeystick-like. it will be interesting to see if the last 50 years of Gergis12 hold up. it appears that there are some new upside-down proxies to be added to Mann's Tiljander cores. hahahaha
 
oh dear!

Gergis et al 2012 seems to have disappeared from the journal. it could be nothing but it certainly is strange.
 
However, the Gergis reconstruction continues to be used in the IPCC Second Order Draft (released for review in early October). The figure below shows its use in the First Order Draft on the left and its use in the Second Order Draft on the right – the two reconstructions are identical up to smoothing.


However, the attribution has changed. The First Order Draft attributed the reconstruction to Gergis et al (then submitted to Journal of Climate, later accepted and then withdrawn. See CA posts here). The Second Order Draft attributes the Gergis reconstruction to PAGES 2K Consortium (submitted to Science).

I presume that the PAGES 2K Consortium has done a little academic check kiting a la Wahl and Ammann i.e. that they have cited the Gergis et al reconstruction even though the article has been withdrawn. The IPCC then cited the article that kited the check (a kitation? )

It would be interesting to see precisely how the PAGES 2K Consortium (of which Gergis was a member) stickhandled their citation of the withdrawn Gergis et al article. I doubt that they were entirely candid with Sciencemag on the matter.

The PAGES 2K consortium article should be online to Second Order Draft reviewers at the WG1 website, but I haven’t seen it because I haven’t signed up as a reviewer since I am not prepared to agree to the secrecy demands instituted by Thomas Stocker at Phil Jones’ urging. But for any IPCC reviewers reading this post, take a look. See if this most recent check-kiting makes you proud to be part of the organization.

from Climate Audit
 

Forum List

Back
Top