I picture Zooey Daschale manic pixie girl on acid. (-:I just told you. The U-3 measures how much available labor is not being used: the number of people who are available and actively looked for work in previous 4 weeks (unemployed) as a percent of unemployed plus employed (Labor Force)Why ask such a silly question. Do you know what the U-3 and u-6 measure?Much more accurate at what? The two measures don't measure the same thing. You can't compare them as they're answering completely different questions.The U-6 is much more accurate. Only dunces don't know this...like you.
The U-3 tells us how much available labor is not being used.
The U-6 tells us how much available and potentially available labor is not being used to its fullest capacity.
So which one you use entirely depends on what you want to know.
Oh, and statistically speaking, the U-6 is much less accurate because marginally attached and part time for economic reasons have larger sample error (because they are small components) and non-sample error (because the definitions are so precise, they might be confusing.
The U-6 measures how much available and potentially available labor is not being used to its fullest capacity: the number of Unemployed plus the number of people who want and are available and who actively looked for work in previous 12 months but not previous 4 weeks (marginally attached) plus those who want and are available to work 35+ hours but who are working < 35 due to slow or slack business or inability to find full time work (part time for economic reasons) as a percent of the Labor Force plus the Marginally Attached.
Those are different things and can't be compared
No, I don't know it. It measures what it's supposed to measure. I have no idea what you mean by structurally inaccurate.The u-3 is structurally inaccurate and you know it.
It is more accurate at measuring what it is supposed to measure, but mush less accurate at measuring what the U-3 is supposed to measure.The U-6 has problems, but is more accurate than u-3.
"The people who cast the votes decide nothing. The people who count the votes decide everything." - Joseph Stalin
Get my drift?
As PC goes all tinfoil hat on us
Navigation
Install the app
How to install the app on iOS
Follow along with the video below to see how to install our site as a web app on your home screen.

Note: This feature currently requires accessing the site using the built-in Safari browser.
More options
You are using an out of date browser. It may not display this or other websites correctly.
You should upgrade or use an alternative browser.
You should upgrade or use an alternative browser.
Fox Reports That 98,000,000 Americans Out Of Work
- Thread starter Campbell
- Start date

I just told you. The U-3 measures how much available labor is not being used: the number of people who are available and actively looked for work in previous 4 weeks (unemployed) as a percent of unemployed plus employed (Labor Force)Why ask such a silly question. Do you know what the U-3 and u-6 measure?Much more accurate at what? The two measures don't measure the same thing. You can't compare them as they're answering completely different questions.The U-6 is much more accurate. Only dunces don't know this...like you.
The U-3 tells us how much available labor is not being used.
The U-6 tells us how much available and potentially available labor is not being used to its fullest capacity.
So which one you use entirely depends on what you want to know.
Oh, and statistically speaking, the U-6 is much less accurate because marginally attached and part time for economic reasons have larger sample error (because they are small components) and non-sample error (because the definitions are so precise, they might be confusing.
The U-6 measures how much available and potentially available labor is not being used to its fullest capacity: the number of Unemployed plus the number of people who want and are available and who actively looked for work in previous 12 months but not previous 4 weeks (marginally attached) plus those who want and are available to work 35+ hours but who are working < 35 due to slow or slack business or inability to find full time work (part time for economic reasons) as a percent of the Labor Force plus the Marginally Attached.
Those are different things and can't be compared
No, I don't know it. It measures what it's supposed to measure. I have no idea what you mean by structurally inaccurate.The u-3 is structurally inaccurate and you know it.
It is more accurate at measuring what it is supposed to measure, but mush less accurate at measuring what the U-3 is supposed to measure.The U-6 has problems, but is more accurate than u-3.
"The people who cast the votes decide nothing. The people who count the votes decide everything." - Joseph Stalin
Get my drift?
As PC goes all tinfoil hat on us
Want to see reality again?
Sure:
1. "...take-home pay for many American workers has effectively fallen since the economic recovery began in 2009, according to a new study by an advocacy group that is to be released on Thursday.
The declines were greatest for the lowest-paid workers in sectors where hiring has been strong — home health care, food preparation and retailing — even though wages were already below average to begin with in those service industries.
“Stagnant wages are a problem for everyone at this point, but the imbalance in the economy has become more pronounced since the recession,”..."http://www.nytimes.com/2015/09/03/b...rkers-see-biggest-drop-in-paychecks.html?_r=0
2."....US hourly wages have not only not increased for the past 7 years,but for thevast majority of the labor force continue to decline,.... just the month of August will be enough to provide the Trump - and every other - campaign with enough soundbites and pivot points to last it for weeks on end: namely,that in August a whopping 698,000 native-born Americans lost their job.This drop was offset by 204,000 foreign-born Americans, who got a job in the month of August. ....since December 2007, according to the Household Survey,only 790,000 native born Americanjobs have been added.Contrast that withthe 2.1 million foreign-born Americanswho have found a job over the same time period..."698K Native-Born Americans Lost Their Job In August: Why This Suddenly Is The Most Important Jobs Chart | Zero Hedge
3. October 2015: "Payrolls Disaster: Only 142K Jobs Added In September With Zero Wage Growth; August Revised Much Lower"Payrolls Disaster: Only 142K Jobs Added In September With Zero Wage Growth; August Revised Much Lower | Zero Hedge
4. "Obamacare health insurance co-ops surged past the $1 billion mark in losses this week, making history of sorts.The insolvencies, totaling $1.36 billion, mean that the co-ops have burned through more than half of theoriginal $2 billion appropriatedin 2010 for the program under the Affordable Care Act. The funds were loaned to the start-up co-ops in 2012 and were to be repaid in 15 years, according to the Centers for Medicare and Medicaid Services, which manages Obamacare.
...13 of the 23 federally-financed Obamacare co-ops have officially failed in only two years. Most are in the process of default as insurance regulators attempt to pay customer’s medical bills, cover medical providers and pay other creditors.
Obamacare Co-Op Mess Causes $1.3 Billion In Losses
5."Obama Administration Announces 144 Big Regulations Right Before Thanksgiving
This is a new record, beating the previous high of 136 set by President Obama this spring."
Obama Administration Announces 144 Big Regulations Right Before Thanksgiving
6. "...ObamaCare experiment costing taxpayers $2.4 billionis failing. The co-ops were founded on the idealistic belief that community members could band together to create health insurance companies that would be member-driven, service-oriented, and would not have to answer to shareholders or turn a profit."
400,000 Citizens To Lose Health Insurance (Again) Because Of Obamacare Co-Op Failures
7. "The U.S. expanded at a 2.2% rate through the first nine months of the year, and the economy is projected to grow at a similar pace in the fourth quarter that ends on Dec. 31. If so, the economy will have failed to reach 3% growth for the 10th straight year, marking the slowest stretch since the end of World War II.
Historically the economy has expanded at a 3.3% rate."U.S. economy set to grow less than 3% for the 10th straight year
8. "Congress has now cleared the way for federal debt to pass$20 trillionby the end of the president’s second term. President Obama said the new budget deal will be paid for in a “balanced” and “responsible” way, but on the day the deal was signed, the federal debt jumped $339 billion—a third of a trillion dollars in one day."Societywatch
9.The GDPNow model forecast for real GDP growth (seasonally adjusted annual rate) in the fourth quarter of 2015 is 0.8 percent on January 8, down from 1.0 percent on January 6. The forecast for the contribution of inventory investment to fourth-quarter real GDP growth declined 0.2 percentage points to -0.8 percentage points after this morning's wholesale trade report from the U.S. Census Bureau.GDPNow
10. "Retail Sales in U.S. Decrease to End Weakest Year Since 2009Sales at U.S. retailers declined in December to wrap the weakest year since 2009, raising concern about the momentum in consumer spending heading into 2016. The 0.1 percent drop matched the median forecast of 84 economists surveyed by Bloomberg and followed a 0.4 percent gain in November, Commerce Department figures showed Friday in Washington. For all of 2015, purchases climbed 2.1 percent, the smallest advance of the current economic expansion."Retail Sales in U.S. Decrease to End Weakest Year Since 2009
11. " The federal government heavily subsidizes higher education through a complex system of grants and loans. While the programs are great for colleges — they haveenabledan astronomical increase in tuition — they contain few measures holding the institutions accountable to their students. As a result, only59 percentof students graduate from four-year colleges and universities within six years. Those lucky enough to graduate face another hurdle:44 percentof recent college graduates occupy jobs which do not require a college degree. Taken together, these numbers suggest that only one-third of college enrollees emerge from the system with both a degree and a relevant job." What "Free" College Can't Fix | Preston Cooper
12. Obama is the first President never to have had a year of 3% or better economic growth: "...annual growth during Obama’s “recovery” has never topped 3%. By comparison, it never fell below 3% during the Reagan recovery. And in the nine years following the 1990-91 recession, GDP grew faster than 3% in all but two. Heck, even Jimmy Carter had some strong growth years." President Obama’s Growth Gap Hits $1.31 Trillion
a. "The years since 2007 have been a macroeconomic disaster for the United States of a magnitude unprecedented since the Great Depression." Obama: Always Wrong, Never In Doubt
b. "....first president since Hoover to never have a single year above 3% GDP growth."Obama economy is 'amazing,' says hedge fund billionaire
13. According to the2016 Index of Economic Freedom, an annual publication by The Heritage Foundation, America’s economic freedom has tumbled. With losses of economic freedom in eight of the past nine years, the U.S. has tied its worst score ever, wiping out a decade of progress. Since early2009:
· Government spending has exploded, amounting to $29,867 per household in 2015.
· The national debt has risen to $125,000 for every tax filing household in America—a total over $18 trillion.
· The government takeover of health care is raising prices and disrupting markets.
· Bailouts and new government regulations have increased uncertainty, stifling investment and job creation. America’s Economic Freedom Has Rapidly Declined Under Obama
Let me know is can dispute any......any......of this.
Or....if you would like a couple dozen more examples of the ineptitude of Obama...and, yours as well.
I picture Zooey Daschale manic pixie girl on acid. (-:I just told you. The U-3 measures how much available labor is not being used: the number of people who are available and actively looked for work in previous 4 weeks (unemployed) as a percent of unemployed plus employed (Labor Force)Why ask such a silly question. Do you know what the U-3 and u-6 measure?Much more accurate at what? The two measures don't measure the same thing. You can't compare them as they're answering completely different questions.
The U-3 tells us how much available labor is not being used.
The U-6 tells us how much available and potentially available labor is not being used to its fullest capacity.
So which one you use entirely depends on what you want to know.
Oh, and statistically speaking, the U-6 is much less accurate because marginally attached and part time for economic reasons have larger sample error (because they are small components) and non-sample error (because the definitions are so precise, they might be confusing.
The U-6 measures how much available and potentially available labor is not being used to its fullest capacity: the number of Unemployed plus the number of people who want and are available and who actively looked for work in previous 12 months but not previous 4 weeks (marginally attached) plus those who want and are available to work 35+ hours but who are working < 35 due to slow or slack business or inability to find full time work (part time for economic reasons) as a percent of the Labor Force plus the Marginally Attached.
Those are different things and can't be compared
No, I don't know it. It measures what it's supposed to measure. I have no idea what you mean by structurally inaccurate.The u-3 is structurally inaccurate and you know it.
It is more accurate at measuring what it is supposed to measure, but mush less accurate at measuring what the U-3 is supposed to measure.The U-6 has problems, but is more accurate than u-3.
"The people who cast the votes decide nothing. The people who count the votes decide everything." - Joseph Stalin
Get my drift?
As PC goes all tinfoil hat on us
Ohhh.....so you're the one cheering for failure!
U.S. Census Bureau InvestigationThe UE measures the percent of the labor force that is not working. That is all it is supposed to measure. In order for it to be a "lie," then that number must be inaccurate. But the complaint is NOT that the number is inaccurate, but that it doesn't measure something else entirely. Which is odd.Oh brother...you never fail to post ignorance. Partisans...they are NUTS!!!Take away stay at home moms, 16-24 year olds, the disabled and retirees from labor force participation and what do you get?
4.9 % unemployment rate
The numbers don't lie
Only those who want to see stay at home moms, the disabled, teens and the elderly back in the workforce care about labor participation rate
"The Big Lie: 5.6% Unemployment
The official unemployment rate, as reported by the U.S. Department of Labor, is extremely misleading.
Right now, we're hearing much celebrating from the media, the White House and Wall Street about how unemployment is "down" to 5.6%. The cheerleading for this number is deafening. The media loves a comeback story, the White House wants to score political points and Wall Street would like you to stay in the market.
While you are as unemployed as one can possibly be, and tragically may never find work again, you arenotcounted in the figure we see relentlessly in the news -- currently 5.6%. Right now, as many as 30 million Americans are either out of work or severely underemployed. Trust me, the vast majority of them aren't throwing parties to toast "falling" unemployment.
Right now, the U.S. is delivering at a staggeringlylow rate of 44%, which is the number of full-time jobs as a percent of the adult population,..." The Big Lie: 5.6% Unemployment
So, PoliticalChic....does the headline Unemployment rate accurately show the percent of the labor force which is unemployed, taking into account seasonal labor market patterns?
Don't be so gullible.
"Census ‘faked’ 2012 election jobs report
In the home stretch of the 2012 presidential campaign, from August to September, the unemployment rate fell sharply — raising eyebrows from Wall Street to Washington.
The decline — from 8.1 percent in August to 7.8 percent in September — might not have been all it seemed. The numbers, according to a reliable source, were manipulated."
http://nypost.com/2013/11/18/census-faked-2012-election-jobs-report/
The evidence supports that Subject 1 left a voicemail message for Complainant in 2010. The statements of two independent, third-party witnesses (Supervisor 3 and EEO Counselor) provide corroboration to the existence of this voicemail and that the voice on the message was that of Subject 1’s. In addition, subject 1 admits that he left voicemail messages for Complainant during this time period.
However, OIG is unable to confirm the precise contents of the voicemail message. Complainant did not retain the message nor was it ever provided in electronic form or transcribed for any third parties.
As such, OIG is unable to analyze the contents of the message. The third-party witnesses who heard the voicemail message have varying recollections of its contents, but, importantly, neither recalls the message specifically directing falsification.
We did not find any evidence to support any oral conversations between Subject 1 and either Key Witness or Complainant where Subject 1 purportedly instructed his subordinates to falsify data.
There are no recordings of any such conversations. Subject 1 denies the allegations made by Key Witness and Complainant, and his denial is supported by our investigation. OIG conducted extensive investigative activities to uncover whether there were other examples of falsification instructions by Subject 1 to any of his other subordinates in addition to the ones alleged. No other instances were identified. For example, OIG interviewed a sample of 50 field staff in the Philadelphia Regional Office.
None of them reported ever being asked by a supervisor to falsify data. Moreover, in the more than 100 interviews conducted by OIG as part of this investigation, no witnesses other than Key Witness or Complainant reported any falsification concerns relating to Subject 1.
In sum, our investigation found no evidence supporting the allegation that Subject 1 instructed his subordinates to falsify data. OIG concludes that while Subject 1 did leave a voicemail message for Complainant in 2010, there is a lack of evidence to support any direct instruction to falsify data.
At most, the voicemail message from Subject 1 appears to have been vague and poorly worded, which could have led to it being interpreted as an instruction to falsify survey data
OIG did not find any evidence to support allegations of Subject 1 or Subject 2 tampering with subordinate’s survey responses or deleting their emails. To the contrary, there is evidence to support a finding that no such tampering occurred.
OIG did not find any evidence to support allegations that supervisors in the Philadelphia Regional Office manipulated, or attempted to manipulate, the unemployment rate prior to the 2012 presidential election. Nor did our investigation find any evidence to support that such manipulation is likely from a statistical perspective.
OIG performed the following analyses: (1) reviewed Key Witness’s case outcomes (e.g. employed, unemployed, not in labor force) to assess whether he had an unexpectedly low number of unemployed
cases in his workload; (2) assessed whether it was theoretically possible for Field Representatives to artificially depress the unemployment rate through falsification; and (3) considered the likelihood of Field Representative falsification substantively affecting the national unemployment rate in September 2012, given the Census Bureau’s quality assurance procedures, employment data trends, and interviews with more than 75 Philadelphia Regional Office employees.
Did Key Witness Attempt to Reduce the National Unemployment Rate through Falsification?
The individual identified as a repeated falsifier of survey data, Key Witness, was removed from employment at the Census Bureau in August 2011. Key Witness’s falsification could not have impacted the unemployment numbers more than a year later. Still, to assess whether Key Witness falsified his cases in a systematic direction (e.g., listing all cases as employed), OIG reviewed the CPS cases worked by Key Witness. During August and September 2010 - the two months immediately following when Key Witness alleges he was instructed to falsify CPS data — Key Witness completed surveys for 64 individuals. Of those 64, he classified 29 as employed, 10 as unemployed, and 25 as not in labor force. In other words, Key Witness did not appear to falsify his cases in an attempt to decrease the unemployment rate — he entered 10 of his 39 in labor force cases (26 percent) as unemployed, nearly twenty percentage points higher than the national average.
In which case the U-6 is no more accurate than the U-3. And the participation rate is inaccurate too. I find it odd that some BLS data are accepted and some rejected.I just told you. The U-3 measures how much available labor is not being used: the number of people who are available and actively looked for work in previous 4 weeks (unemployed) as a percent of unemployed plus employed (Labor Force)Why ask such a silly question. Do you know what the U-3 and u-6 measure?Much more accurate at what? The two measures don't measure the same thing. You can't compare them as they're answering completely different questions.The U-6 is much more accurate. Only dunces don't know this...like you.The numbers don't lie
Only those who want to see stay at home moms, the disabled, teens and the elderly back in the workforce care about labor participation rate
The U-3 tells us how much available labor is not being used.
The U-6 tells us how much available and potentially available labor is not being used to its fullest capacity.
So which one you use entirely depends on what you want to know.
Oh, and statistically speaking, the U-6 is much less accurate because marginally attached and part time for economic reasons have larger sample error (because they are small components) and non-sample error (because the definitions are so precise, they might be confusing.
The U-6 measures how much available and potentially available labor is not being used to its fullest capacity: the number of Unemployed plus the number of people who want and are available and who actively looked for work in previous 12 months but not previous 4 weeks (marginally attached) plus those who want and are available to work 35+ hours but who are working < 35 due to slow or slack business or inability to find full time work (part time for economic reasons) as a percent of the Labor Force plus the Marginally Attached.
Those are different things and can't be compared
No, I don't know it. It measures what it's supposed to measure. I have no idea what you mean by structurally inaccurate.The u-3 is structurally inaccurate and you know it.
It is more accurate at measuring what it is supposed to measure, but mush less accurate at measuring what the U-3 is supposed to measure.The U-6 has problems, but is more accurate than u-3.
"The people who cast the votes decide nothing. The people who count the votes decide everything." - Joseph Stalin
Get my drift?
But in any case, there has never been any evidence of manipulation of the data.
U.S. Census Bureau InvestigationThe UE measures the percent of the labor force that is not working. That is all it is supposed to measure. In order for it to be a "lie," then that number must be inaccurate. But the complaint is NOT that the number is inaccurate, but that it doesn't measure something else entirely. Which is odd.Oh brother...you never fail to post ignorance. Partisans...they are NUTS!!!
The numbers don't lie
Only those who want to see stay at home moms, the disabled, teens and the elderly back in the workforce care about labor participation rate
"The Big Lie: 5.6% Unemployment
The official unemployment rate, as reported by the U.S. Department of Labor, is extremely misleading.
Right now, we're hearing much celebrating from the media, the White House and Wall Street about how unemployment is "down" to 5.6%. The cheerleading for this number is deafening. The media loves a comeback story, the White House wants to score political points and Wall Street would like you to stay in the market.
While you are as unemployed as one can possibly be, and tragically may never find work again, you arenotcounted in the figure we see relentlessly in the news -- currently 5.6%. Right now, as many as 30 million Americans are either out of work or severely underemployed. Trust me, the vast majority of them aren't throwing parties to toast "falling" unemployment.
Right now, the U.S. is delivering at a staggeringlylow rate of 44%, which is the number of full-time jobs as a percent of the adult population,..." The Big Lie: 5.6% Unemployment
So, PoliticalChic....does the headline Unemployment rate accurately show the percent of the labor force which is unemployed, taking into account seasonal labor market patterns?
Don't be so gullible.
"Census ‘faked’ 2012 election jobs report
In the home stretch of the 2012 presidential campaign, from August to September, the unemployment rate fell sharply — raising eyebrows from Wall Street to Washington.
The decline — from 8.1 percent in August to 7.8 percent in September — might not have been all it seemed. The numbers, according to a reliable source, were manipulated."
http://nypost.com/2013/11/18/census-faked-2012-election-jobs-report/
The evidence supports that Subject 1 left a voicemail message for Complainant in 2010. The statements of two independent, third-party witnesses (Supervisor 3 and EEO Counselor) provide corroboration to the existence of this voicemail and that the voice on the message was that of Subject 1’s. In addition, subject 1 admits that he left voicemail messages for Complainant during this time period.
However, OIG is unable to confirm the precise contents of the voicemail message. Complainant did not retain the message nor was it ever provided in electronic form or transcribed for any third parties.
As such, OIG is unable to analyze the contents of the message. The third-party witnesses who heard the voicemail message have varying recollections of its contents, but, importantly, neither recalls the message specifically directing falsification.
We did not find any evidence to support any oral conversations between Subject 1 and either Key Witness or Complainant where Subject 1 purportedly instructed his subordinates to falsify data.
There are no recordings of any such conversations. Subject 1 denies the allegations made by Key Witness and Complainant, and his denial is supported by our investigation. OIG conducted extensive investigative activities to uncover whether there were other examples of falsification instructions by Subject 1 to any of his other subordinates in addition to the ones alleged. No other instances were identified. For example, OIG interviewed a sample of 50 field staff in the Philadelphia Regional Office.
None of them reported ever being asked by a supervisor to falsify data. Moreover, in the more than 100 interviews conducted by OIG as part of this investigation, no witnesses other than Key Witness or Complainant reported any falsification concerns relating to Subject 1.
In sum, our investigation found no evidence supporting the allegation that Subject 1 instructed his subordinates to falsify data. OIG concludes that while Subject 1 did leave a voicemail message for Complainant in 2010, there is a lack of evidence to support any direct instruction to falsify data.
At most, the voicemail message from Subject 1 appears to have been vague and poorly worded, which could have led to it being interpreted as an instruction to falsify survey data
OIG did not find any evidence to support allegations of Subject 1 or Subject 2 tampering with subordinate’s survey responses or deleting their emails. To the contrary, there is evidence to support a finding that no such tampering occurred.
OIG did not find any evidence to support allegations that supervisors in the Philadelphia Regional Office manipulated, or attempted to manipulate, the unemployment rate prior to the 2012 presidential election. Nor did our investigation find any evidence to support that such manipulation is likely from a statistical perspective.
OIG performed the following analyses: (1) reviewed Key Witness’s case outcomes (e.g. employed, unemployed, not in labor force) to assess whether he had an unexpectedly low number of unemployed
cases in his workload; (2) assessed whether it was theoretically possible for Field Representatives to artificially depress the unemployment rate through falsification; and (3) considered the likelihood of Field Representative falsification substantively affecting the national unemployment rate in September 2012, given the Census Bureau’s quality assurance procedures, employment data trends, and interviews with more than 75 Philadelphia Regional Office employees.
Did Key Witness Attempt to Reduce the National Unemployment Rate through Falsification?
The individual identified as a repeated falsifier of survey data, Key Witness, was removed from employment at the Census Bureau in August 2011. Key Witness’s falsification could not have impacted the unemployment numbers more than a year later. Still, to assess whether Key Witness falsified his cases in a systematic direction (e.g., listing all cases as employed), OIG reviewed the CPS cases worked by Key Witness. During August and September 2010 - the two months immediately following when Key Witness alleges he was instructed to falsify CPS data — Key Witness completed surveys for 64 individuals. Of those 64, he classified 29 as employed, 10 as unemployed, and 25 as not in labor force. In other words, Key Witness did not appear to falsify his cases in an attempt to decrease the unemployment rate — he entered 10 of his 39 in labor force cases (26 percent) as unemployed, nearly twenty percentage points higher than the national average.
Pleeeezzzzeee!
Just like Lois Lerner didn't target conservative groups!
"Just one month before the 2012 election, the Obama campaign received a major illegal campaign contribution from the Commerce Department. The Department’s Bureau of Labor Statistics (BLS) reported on October 5, 2012 that the nation’s unemployment rate suddenly dropped sharply over the prior month, from 8.1% to 7.8%. That supposedly ended the longest period in the nation’s history with unemployment over 8%, except for the Great Depression, which occurred under President Obama.
Just before the election. How convenient.
.....how inconsistent the supposed unemployment drop was with other contemporaneous economic data. The sharp unemployment drop supposedly resulted from a total of 114,000 new jobs created in September, 2012, according to the Establishment Survey of business payrolls of the Bureau of Labor Statistics that the Obama Administration had been emphasizing throughout its first term. But economist John Lott noted at Foxnews.comthat the working age population had grown by 206,000 in September, 2012. With normal labor force participation during a recovery from a steep recession, that would have required 138,000 new jobs that month, just to keep pace with population growth, let alone to reduce the unemployment rate.."
Did The BLS Give Obama A Major Election 2012 Gift?
Wise up.
- Jan 8, 2011
- 64,838
- 34,345
- 2,605
The numbers lie just like leftists lie.Oh brother...you never fail to post ignorance. Partisans...they are NUTS!!!
The numbers don't lie
Only those who want to see stay at home moms, the disabled, teens and the elderly back in the workforce care about labor participation rate
"The Big Lie: 5.6% Unemployment
The official unemployment rate, as reported by the U.S. Department of Labor, is extremely misleading.
Right now, we're hearing much celebrating from the media, the White House and Wall Street about how unemployment is "down" to 5.6%. The cheerleading for this number is deafening. The media loves a comeback story, the White House wants to score political points and Wall Street would like you to stay in the market.
While you are as unemployed as one can possibly be, and tragically may never find work again, you arenotcounted in the figure we see relentlessly in the news -- currently 5.6%. Right now, as many as 30 million Americans are either out of work or severely underemployed. Trust me, the vast majority of them aren't throwing parties to toast "falling" unemployment.
Right now, the U.S. is delivering at a staggeringlylow rate of 44%, which is the number of full-time jobs as a percent of the adult population,..." The Big Lie: 5.6% Unemployment
Total Bullshit....it is a LIE
Unemployment is down to 4.9%
Thanks President Obama!
You remain a liar and a fool.
One more than the other....depending on the day.
The numbers don't lie
Unemployment is down to 4.9%
Spin baby, spin
The numbers lie just like leftists lie.The numbers don't lie
Only those who want to see stay at home moms, the disabled, teens and the elderly back in the workforce care about labor participation rate
"The Big Lie: 5.6% Unemployment
The official unemployment rate, as reported by the U.S. Department of Labor, is extremely misleading.
Right now, we're hearing much celebrating from the media, the White House and Wall Street about how unemployment is "down" to 5.6%. The cheerleading for this number is deafening. The media loves a comeback story, the White House wants to score political points and Wall Street would like you to stay in the market.
While you are as unemployed as one can possibly be, and tragically may never find work again, you arenotcounted in the figure we see relentlessly in the news -- currently 5.6%. Right now, as many as 30 million Americans are either out of work or severely underemployed. Trust me, the vast majority of them aren't throwing parties to toast "falling" unemployment.
Right now, the U.S. is delivering at a staggeringlylow rate of 44%, which is the number of full-time jobs as a percent of the adult population,..." The Big Lie: 5.6% Unemployment
Total Bullshit....it is a LIE
Unemployment is down to 4.9%
Thanks President Obama!
You remain a liar and a fool.
One more than the other....depending on the day.
The numbers don't lie
Unemployment is down to 4.9%
Spin baby, spin
If you listened to Bernie Sander's victory speech...you'd have plenty of proof that you are spot on.
I love how he mentions the "Billionaire Class"!
Small class....536 members.
And the 1%ers.......the Leftist fools don't even know who they are:
Who are the ‘Top 1%,” so reviled by the class warriors?
- If the Occupy Wall Street protests are aiming to take down the "1 percent" of Americans who control the increasingly largest chunk of our nation's wealth, perhaps they need to redirect their efforts to somewhere other than Wall Street.
- According to Nicole Lapin of CNN, financial services professionals make up just 14 percent of that top 1 percent of wage earners. Their average salary of $311,000 per year, while quite gaudy, falls just below the threshold needed to break into the highest-earning subset.
- The biggest single group of professionals in the top one percent is actually doctors, who make up 16 percent of that subset.
- Executives and managers outside of finance make up 31% of the total, but Lapin didn't break them down by industry.
- David Carr of The New York Times would also like to offer up his bosses as targets for the mass uprising, pointing out in his column today that media executives are some of the worst offenders when it comes to CEOs who reap multi-million dollar bonuses and golden parachutes by slashing budgets and laying off rank-and-file workers. Go ahead and add them to the list.
- So those who want to direct their anger at the winners in the income inequality sweepstakes might want to look beyond the lower of half of Manhattan. There's plenty of other folks closer to home that you might want to have a word with. Where Does the Top 1% Really Work?
- Lawyers make up 9 percent. The 1 Percent Are Not All Wall Streeters—They're the Bosses
- To get into the “top 1%” of Americans you don’t need to be a billionaire or millionaire or half-millionaire. The minimum wage earners in that group make about $343k/year….The “top 1%” of wage earners earn 17% of the nation’s income.Who the Heck Are the "Top 1%"?!!
$343,000.....
A married pair of cops can earn that.
"The highest-paid employee in Westchester County was police officer Wayne Mullaney, who made $319,628 between April 2013 and March 2014, the report said.
The highest-paid local government employee was Charles E. Ewald, a jail warden who was paid $414,527 by Suffolk County.
In all, 1,803 local government employees cleared more money between than Gov. Andrew Cuomo, who made $179,000, according to the report."
Westchester Leads NY In Salaries For County Workers, Police
The commies are such abject idiots.
BLS is not part of the Department of Commerce, but the Department of Labor."Just one month before the 2012 election, the Obama campaign received a major illegal campaign contribution from the Commerce Department. The Department’s Bureau of Labor Statistics (BLS) reported on October 5, 2012 that the nation’s unemployment rate suddenly dropped sharply over the prior month, from 8.1% to 7.8%. That supposedly ended the longest period in the nation’s history with unemployment over 8%, except for the Great Depression, which occurred under President Obama.
Just before the election. How convenient.
At that time, the one Presidentially appointed position, Commissioner, was vacant and the acting Commissioner was a career civil servant who'd been at BLS since the Reagan administration.
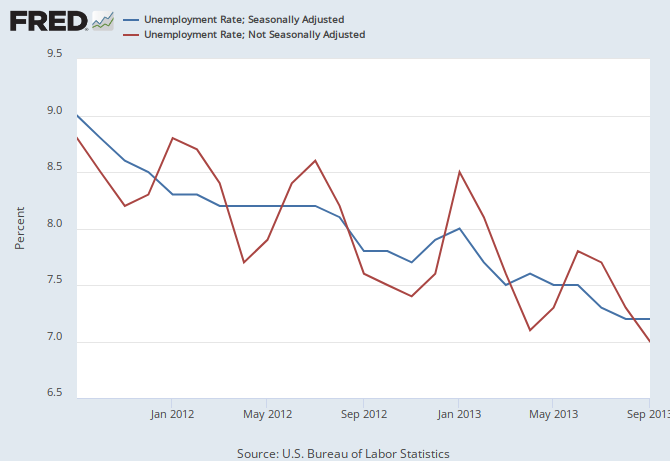
Buit the Unemployment rate doesn't use the Establishment survey to calculate the UE rate. It uses a Household Survey...the Current Population Survey. That showed an increase of 626,000 employed. And while it appeared to be a large jump at the time, it does not appear that way in hindsight:.....how inconsistent the supposed unemployment drop was with other contemporaneous economic data. The sharp unemployment drop supposedly resulted from a total of 114,000 new jobs created in September, 2012, according to the Establishment Survey of business payrolls of the Bureau of Labor Statistics that the Obama Administration had been emphasizing throughout its first term. But economist John Lott noted at Foxnews.comthat the working age population had grown by 206,000 in September, 2012. With normal labor force participation during a recovery from a steep recession, that would have required 138,000 new jobs that month, just to keep pace with population growth, let alone to reduce the unemployment rate.."
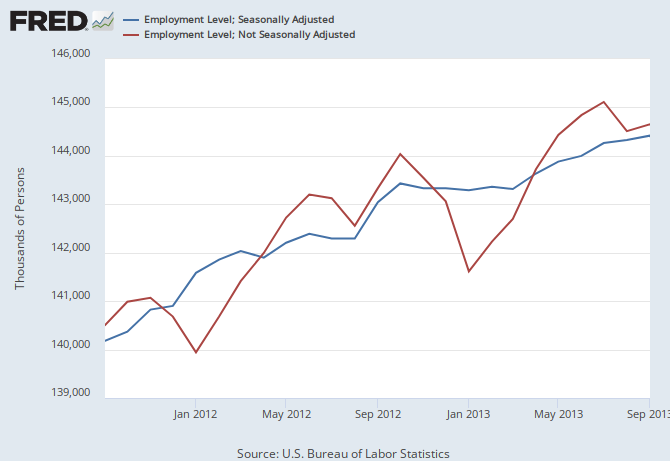
And looking at the UE rate the change doesn't look unusual either.:
And as I showed, the OIG investigation showed no manipulation or even possible manipulation by Census.
I will gladly listen to any credible evidence.Wise up.
Those terrible1%ers!!!!!
"Port Authority Beat Cop Earns $221,000
Dozens of PAPD officers earn more than $200,000 in 2011, thanks to overtime."
Port Authority Beat Cop Earns $221,000
"Port Authority Beat Cop Earns $221,000
Dozens of PAPD officers earn more than $200,000 in 2011, thanks to overtime."
Port Authority Beat Cop Earns $221,000
She doesn't have any evidence. See the post above mine.BLS is not part of the Department of Commerce, but the Department of Labor."Just one month before the 2012 election, the Obama campaign received a major illegal campaign contribution from the Commerce Department. The Department’s Bureau of Labor Statistics (BLS) reported on October 5, 2012 that the nation’s unemployment rate suddenly dropped sharply over the prior month, from 8.1% to 7.8%. That supposedly ended the longest period in the nation’s history with unemployment over 8%, except for the Great Depression, which occurred under President Obama.
Just before the election. How convenient.
At that time, the one Presidentially appointed position, Commissioner, was vacant and the acting Commissioner was a career civil servant who'd been at BLS since the Reagan administration.
Buit the Unemployment rate doesn't use the Establishment survey to calculate the UE rate. It uses a Household Survey...the Current Population Survey. That showed an increase of 626,000 employed. And while it appeared to be a large jump at the time, it does not appear that way in hindsight:.....how inconsistent the supposed unemployment drop was with other contemporaneous economic data. The sharp unemployment drop supposedly resulted from a total of 114,000 new jobs created in September, 2012, according to the Establishment Survey of business payrolls of the Bureau of Labor Statistics that the Obama Administration had been emphasizing throughout its first term. But economist John Lott noted at Foxnews.comthat the working age population had grown by 206,000 in September, 2012. With normal labor force participation during a recovery from a steep recession, that would have required 138,000 new jobs that month, just to keep pace with population growth, let alone to reduce the unemployment rate.."
And looking at the UE rate the change doesn't look unusual either.:
And as I showed, the OIG investigation showed no manipulation or even possible manipulation by Census.
I will gladly listen to any credible evidence.Wise up.
edthecynic
Censored for Cynicism
- Oct 20, 2008
- 43,044
- 6,883
- 1,830
Let me know when you learn to speak American.Let me know is can dispute any......any......of this.
BLS is not part of the Department of Commerce, but the Department of Labor."Just one month before the 2012 election, the Obama campaign received a major illegal campaign contribution from the Commerce Department. The Department’s Bureau of Labor Statistics (BLS) reported on October 5, 2012 that the nation’s unemployment rate suddenly dropped sharply over the prior month, from 8.1% to 7.8%. That supposedly ended the longest period in the nation’s history with unemployment over 8%, except for the Great Depression, which occurred under President Obama.
Just before the election. How convenient.
At that time, the one Presidentially appointed position, Commissioner, was vacant and the acting Commissioner was a career civil servant who'd been at BLS since the Reagan administration.
Buit the Unemployment rate doesn't use the Establishment survey to calculate the UE rate. It uses a Household Survey...the Current Population Survey. That showed an increase of 626,000 employed. And while it appeared to be a large jump at the time, it does not appear that way in hindsight:.....how inconsistent the supposed unemployment drop was with other contemporaneous economic data. The sharp unemployment drop supposedly resulted from a total of 114,000 new jobs created in September, 2012, according to the Establishment Survey of business payrolls of the Bureau of Labor Statistics that the Obama Administration had been emphasizing throughout its first term. But economist John Lott noted at Foxnews.comthat the working age population had grown by 206,000 in September, 2012. With normal labor force participation during a recovery from a steep recession, that would have required 138,000 new jobs that month, just to keep pace with population growth, let alone to reduce the unemployment rate.."
And looking at the UE rate the change doesn't look unusual either.:
And as I showed, the OIG investigation showed no manipulation or even possible manipulation by Census.
I will gladly listen to any credible evidence.Wise up.
".... one Presidentially appointed..."
Does that phrase refer to the President who won the "Lie of the Year" award???
Does it, pinqy????
BLS is not part of the Department of Commerce, but the Department of Labor."Just one month before the 2012 election, the Obama campaign received a major illegal campaign contribution from the Commerce Department. The Department’s Bureau of Labor Statistics (BLS) reported on October 5, 2012 that the nation’s unemployment rate suddenly dropped sharply over the prior month, from 8.1% to 7.8%. That supposedly ended the longest period in the nation’s history with unemployment over 8%, except for the Great Depression, which occurred under President Obama.
Just before the election. How convenient.
At that time, the one Presidentially appointed position, Commissioner, was vacant and the acting Commissioner was a career civil servant who'd been at BLS since the Reagan administration.
Buit the Unemployment rate doesn't use the Establishment survey to calculate the UE rate. It uses a Household Survey...the Current Population Survey. That showed an increase of 626,000 employed. And while it appeared to be a large jump at the time, it does not appear that way in hindsight:.....how inconsistent the supposed unemployment drop was with other contemporaneous economic data. The sharp unemployment drop supposedly resulted from a total of 114,000 new jobs created in September, 2012, according to the Establishment Survey of business payrolls of the Bureau of Labor Statistics that the Obama Administration had been emphasizing throughout its first term. But economist John Lott noted at Foxnews.comthat the working age population had grown by 206,000 in September, 2012. With normal labor force participation during a recovery from a steep recession, that would have required 138,000 new jobs that month, just to keep pace with population growth, let alone to reduce the unemployment rate.."
And looking at the UE rate the change doesn't look unusual either.:
And as I showed, the OIG investigation showed no manipulation or even possible manipulation by Census.
I will gladly listen to any credible evidence.Wise up.
Does "OIG" refer to 'Inspector General'.....????
You know....the folks Obama fires if they won't toe his line?????
1. There was the case of Sacramento’s Democrat Mayor Kevin Johnson. An unfortunate government watchdog made the mistake of looking too closely at his misuse of government funds…and suddenly found himself out of a job. Since inspectors genereal are supposed to be independent, ‘else how do they conduct investigations into federal agencies? In fact, Congress passed the Inspectors General Reform Act of 2008. (Public Law 110-409 : “To amend the Inspector General Act of 1978 to enhance the independence of the Inspectors General, to create a Council of the Inspectors General on Integrity and Efficiency, and for other purposes.”) Barack Obama was a co-sponsor
.
2. Gerald Walpin was the inspector general who oversaw the AmeriCorps program, and he discovered evidence that Democrat Mayor Kevin Johnson had misused $850,000 of the AmeriCorps grant money and ‘used federally-funded AmeriCorps staff for, among other things, "driving [Johnson] to personal appointments, washing his car, and running personal errands." ‘Political Commentary and Opinion | Washington Examiner
a. BTW, did I mention that Kevin Johnson stated that he was ‘a personal friend of President Obama?
3. Walpin referrer the matter for criminal prosecution to the US Attorney for the Eastern District of California, Lawrence Brown. Brown, who had taken over from a Bush appointee, instead entered into settlement talks with Johnson, and on terms very favorable to Johnson. Walpin objected. Ibid.
a. On June 10, 2009, Walpin was given two options: resign immediately or be terminated.
So....you wanna keep sounding stupid????
Gangster Government: Barack Obama and the New Washington ThugocracybyDavid Freddoso
- Aug 4, 2009
- 280,973
- 140,149
- 2,300
The BIG LIE
Fox Reports That 98,000,000 Americans Out Of Work
They are out of the workforce NOT out of work
So, how is one working but not in the workforce? How does one pull that off?
You are not working and have no intention of working
You are not "out of work"...you are "retired"
- Aug 4, 2009
- 280,973
- 140,149
- 2,300
I just told you. The U-3 measures how much available labor is not being used: the number of people who are available and actively looked for work in previous 4 weeks (unemployed) as a percent of unemployed plus employed (Labor Force)Why ask such a silly question. Do you know what the U-3 and u-6 measure?Much more accurate at what? The two measures don't measure the same thing. You can't compare them as they're answering completely different questions.
The U-3 tells us how much available labor is not being used.
The U-6 tells us how much available and potentially available labor is not being used to its fullest capacity.
So which one you use entirely depends on what you want to know.
Oh, and statistically speaking, the U-6 is much less accurate because marginally attached and part time for economic reasons have larger sample error (because they are small components) and non-sample error (because the definitions are so precise, they might be confusing.
The U-6 measures how much available and potentially available labor is not being used to its fullest capacity: the number of Unemployed plus the number of people who want and are available and who actively looked for work in previous 12 months but not previous 4 weeks (marginally attached) plus those who want and are available to work 35+ hours but who are working < 35 due to slow or slack business or inability to find full time work (part time for economic reasons) as a percent of the Labor Force plus the Marginally Attached.
Those are different things and can't be compared
No, I don't know it. It measures what it's supposed to measure. I have no idea what you mean by structurally inaccurate.The u-3 is structurally inaccurate and you know it.
It is more accurate at measuring what it is supposed to measure, but mush less accurate at measuring what the U-3 is supposed to measure.The U-6 has problems, but is more accurate than u-3.
"The people who cast the votes decide nothing. The people who count the votes decide everything." - Joseph Stalin
Get my drift?
As PC goes all tinfoil hat on us
Want to see reality again?
Sure:
1. "...take-home pay for many American workers has effectively fallen since the economic recovery began in 2009, according to a new study by an advocacy group that is to be released on Thursday.
The declines were greatest for the lowest-paid workers in sectors where hiring has been strong — home health care, food preparation and retailing — even though wages were already below average to begin with in those service industries.
“Stagnant wages are a problem for everyone at this point, but the imbalance in the economy has become more pronounced since the recession,”..."http://www.nytimes.com/2015/09/03/b...rkers-see-biggest-drop-in-paychecks.html?_r=0
2."....US hourly wages have not only not increased for the past 7 years,but for thevast majority of the labor force continue to decline,.... just the month of August will be enough to provide the Trump - and every other - campaign with enough soundbites and pivot points to last it for weeks on end: namely,that in August a whopping 698,000 native-born Americans lost their job.This drop was offset by 204,000 foreign-born Americans, who got a job in the month of August. ....since December 2007, according to the Household Survey,only 790,000 native born Americanjobs have been added.Contrast that withthe 2.1 million foreign-born Americanswho have found a job over the same time period..."698K Native-Born Americans Lost Their Job In August: Why This Suddenly Is The Most Important Jobs Chart | Zero Hedge
3. October 2015: "Payrolls Disaster: Only 142K Jobs Added In September With Zero Wage Growth; August Revised Much Lower"Payrolls Disaster: Only 142K Jobs Added In September With Zero Wage Growth; August Revised Much Lower | Zero Hedge
4. "Obamacare health insurance co-ops surged past the $1 billion mark in losses this week, making history of sorts.The insolvencies, totaling $1.36 billion, mean that the co-ops have burned through more than half of theoriginal $2 billion appropriatedin 2010 for the program under the Affordable Care Act. The funds were loaned to the start-up co-ops in 2012 and were to be repaid in 15 years, according to the Centers for Medicare and Medicaid Services, which manages Obamacare.
...13 of the 23 federally-financed Obamacare co-ops have officially failed in only two years. Most are in the process of default as insurance regulators attempt to pay customer’s medical bills, cover medical providers and pay other creditors.
Obamacare Co-Op Mess Causes $1.3 Billion In Losses
5."Obama Administration Announces 144 Big Regulations Right Before Thanksgiving
This is a new record, beating the previous high of 136 set by President Obama this spring."
Obama Administration Announces 144 Big Regulations Right Before Thanksgiving
6. "...ObamaCare experiment costing taxpayers $2.4 billionis failing. The co-ops were founded on the idealistic belief that community members could band together to create health insurance companies that would be member-driven, service-oriented, and would not have to answer to shareholders or turn a profit."
400,000 Citizens To Lose Health Insurance (Again) Because Of Obamacare Co-Op Failures
7. "The U.S. expanded at a 2.2% rate through the first nine months of the year, and the economy is projected to grow at a similar pace in the fourth quarter that ends on Dec. 31. If so, the economy will have failed to reach 3% growth for the 10th straight year, marking the slowest stretch since the end of World War II.
Historically the economy has expanded at a 3.3% rate."U.S. economy set to grow less than 3% for the 10th straight year
8. "Congress has now cleared the way for federal debt to pass$20 trillionby the end of the president’s second term. President Obama said the new budget deal will be paid for in a “balanced” and “responsible” way, but on the day the deal was signed, the federal debt jumped $339 billion—a third of a trillion dollars in one day."Societywatch
9.The GDPNow model forecast for real GDP growth (seasonally adjusted annual rate) in the fourth quarter of 2015 is 0.8 percent on January 8, down from 1.0 percent on January 6. The forecast for the contribution of inventory investment to fourth-quarter real GDP growth declined 0.2 percentage points to -0.8 percentage points after this morning's wholesale trade report from the U.S. Census Bureau.GDPNow
10. "Retail Sales in U.S. Decrease to End Weakest Year Since 2009Sales at U.S. retailers declined in December to wrap the weakest year since 2009, raising concern about the momentum in consumer spending heading into 2016. The 0.1 percent drop matched the median forecast of 84 economists surveyed by Bloomberg and followed a 0.4 percent gain in November, Commerce Department figures showed Friday in Washington. For all of 2015, purchases climbed 2.1 percent, the smallest advance of the current economic expansion."Retail Sales in U.S. Decrease to End Weakest Year Since 2009
11. " The federal government heavily subsidizes higher education through a complex system of grants and loans. While the programs are great for colleges — they haveenabledan astronomical increase in tuition — they contain few measures holding the institutions accountable to their students. As a result, only59 percentof students graduate from four-year colleges and universities within six years. Those lucky enough to graduate face another hurdle:44 percentof recent college graduates occupy jobs which do not require a college degree. Taken together, these numbers suggest that only one-third of college enrollees emerge from the system with both a degree and a relevant job." What "Free" College Can't Fix | Preston Cooper
12. Obama is the first President never to have had a year of 3% or better economic growth: "...annual growth during Obama’s “recovery” has never topped 3%. By comparison, it never fell below 3% during the Reagan recovery. And in the nine years following the 1990-91 recession, GDP grew faster than 3% in all but two. Heck, even Jimmy Carter had some strong growth years." President Obama’s Growth Gap Hits $1.31 Trillion
a. "The years since 2007 have been a macroeconomic disaster for the United States of a magnitude unprecedented since the Great Depression." Obama: Always Wrong, Never In Doubt
b. "....first president since Hoover to never have a single year above 3% GDP growth."Obama economy is 'amazing,' says hedge fund billionaire
13. According to the2016 Index of Economic Freedom, an annual publication by The Heritage Foundation, America’s economic freedom has tumbled. With losses of economic freedom in eight of the past nine years, the U.S. has tied its worst score ever, wiping out a decade of progress. Since early2009:
· Government spending has exploded, amounting to $29,867 per household in 2015.
· The national debt has risen to $125,000 for every tax filing household in America—a total over $18 trillion.
· The government takeover of health care is raising prices and disrupting markets.
· Bailouts and new government regulations have increased uncertainty, stifling investment and job creation. America’s Economic Freedom Has Rapidly Declined Under Obama
Let me know is can dispute any......any......of this.
Or....if you would like a couple dozen more examples of the ineptitude of Obama...and, yours as well.

I just told you. The U-3 measures how much available labor is not being used: the number of people who are available and actively looked for work in previous 4 weeks (unemployed) as a percent of unemployed plus employed (Labor Force)Why ask such a silly question. Do you know what the U-3 and u-6 measure?
The U-6 measures how much available and potentially available labor is not being used to its fullest capacity: the number of Unemployed plus the number of people who want and are available and who actively looked for work in previous 12 months but not previous 4 weeks (marginally attached) plus those who want and are available to work 35+ hours but who are working < 35 due to slow or slack business or inability to find full time work (part time for economic reasons) as a percent of the Labor Force plus the Marginally Attached.
Those are different things and can't be compared
No, I don't know it. It measures what it's supposed to measure. I have no idea what you mean by structurally inaccurate.The u-3 is structurally inaccurate and you know it.
It is more accurate at measuring what it is supposed to measure, but mush less accurate at measuring what the U-3 is supposed to measure.The U-6 has problems, but is more accurate than u-3.
"The people who cast the votes decide nothing. The people who count the votes decide everything." - Joseph Stalin
Get my drift?
As PC goes all tinfoil hat on us
Want to see reality again?
Sure:
1. "...take-home pay for many American workers has effectively fallen since the economic recovery began in 2009, according to a new study by an advocacy group that is to be released on Thursday.
The declines were greatest for the lowest-paid workers in sectors where hiring has been strong — home health care, food preparation and retailing — even though wages were already below average to begin with in those service industries.
“Stagnant wages are a problem for everyone at this point, but the imbalance in the economy has become more pronounced since the recession,”..."http://www.nytimes.com/2015/09/03/b...rkers-see-biggest-drop-in-paychecks.html?_r=0
2."....US hourly wages have not only not increased for the past 7 years,but for thevast majority of the labor force continue to decline,.... just the month of August will be enough to provide the Trump - and every other - campaign with enough soundbites and pivot points to last it for weeks on end: namely,that in August a whopping 698,000 native-born Americans lost their job.This drop was offset by 204,000 foreign-born Americans, who got a job in the month of August. ....since December 2007, according to the Household Survey,only 790,000 native born Americanjobs have been added.Contrast that withthe 2.1 million foreign-born Americanswho have found a job over the same time period..."698K Native-Born Americans Lost Their Job In August: Why This Suddenly Is The Most Important Jobs Chart | Zero Hedge
3. October 2015: "Payrolls Disaster: Only 142K Jobs Added In September With Zero Wage Growth; August Revised Much Lower"Payrolls Disaster: Only 142K Jobs Added In September With Zero Wage Growth; August Revised Much Lower | Zero Hedge
4. "Obamacare health insurance co-ops surged past the $1 billion mark in losses this week, making history of sorts.The insolvencies, totaling $1.36 billion, mean that the co-ops have burned through more than half of theoriginal $2 billion appropriatedin 2010 for the program under the Affordable Care Act. The funds were loaned to the start-up co-ops in 2012 and were to be repaid in 15 years, according to the Centers for Medicare and Medicaid Services, which manages Obamacare.
...13 of the 23 federally-financed Obamacare co-ops have officially failed in only two years. Most are in the process of default as insurance regulators attempt to pay customer’s medical bills, cover medical providers and pay other creditors.
Obamacare Co-Op Mess Causes $1.3 Billion In Losses
5."Obama Administration Announces 144 Big Regulations Right Before Thanksgiving
This is a new record, beating the previous high of 136 set by President Obama this spring."
Obama Administration Announces 144 Big Regulations Right Before Thanksgiving
6. "...ObamaCare experiment costing taxpayers $2.4 billionis failing. The co-ops were founded on the idealistic belief that community members could band together to create health insurance companies that would be member-driven, service-oriented, and would not have to answer to shareholders or turn a profit."
400,000 Citizens To Lose Health Insurance (Again) Because Of Obamacare Co-Op Failures
7. "The U.S. expanded at a 2.2% rate through the first nine months of the year, and the economy is projected to grow at a similar pace in the fourth quarter that ends on Dec. 31. If so, the economy will have failed to reach 3% growth for the 10th straight year, marking the slowest stretch since the end of World War II.
Historically the economy has expanded at a 3.3% rate."U.S. economy set to grow less than 3% for the 10th straight year
8. "Congress has now cleared the way for federal debt to pass$20 trillionby the end of the president’s second term. President Obama said the new budget deal will be paid for in a “balanced” and “responsible” way, but on the day the deal was signed, the federal debt jumped $339 billion—a third of a trillion dollars in one day."Societywatch
9.The GDPNow model forecast for real GDP growth (seasonally adjusted annual rate) in the fourth quarter of 2015 is 0.8 percent on January 8, down from 1.0 percent on January 6. The forecast for the contribution of inventory investment to fourth-quarter real GDP growth declined 0.2 percentage points to -0.8 percentage points after this morning's wholesale trade report from the U.S. Census Bureau.GDPNow
10. "Retail Sales in U.S. Decrease to End Weakest Year Since 2009Sales at U.S. retailers declined in December to wrap the weakest year since 2009, raising concern about the momentum in consumer spending heading into 2016. The 0.1 percent drop matched the median forecast of 84 economists surveyed by Bloomberg and followed a 0.4 percent gain in November, Commerce Department figures showed Friday in Washington. For all of 2015, purchases climbed 2.1 percent, the smallest advance of the current economic expansion."Retail Sales in U.S. Decrease to End Weakest Year Since 2009
11. " The federal government heavily subsidizes higher education through a complex system of grants and loans. While the programs are great for colleges — they haveenabledan astronomical increase in tuition — they contain few measures holding the institutions accountable to their students. As a result, only59 percentof students graduate from four-year colleges and universities within six years. Those lucky enough to graduate face another hurdle:44 percentof recent college graduates occupy jobs which do not require a college degree. Taken together, these numbers suggest that only one-third of college enrollees emerge from the system with both a degree and a relevant job." What "Free" College Can't Fix | Preston Cooper
12. Obama is the first President never to have had a year of 3% or better economic growth: "...annual growth during Obama’s “recovery” has never topped 3%. By comparison, it never fell below 3% during the Reagan recovery. And in the nine years following the 1990-91 recession, GDP grew faster than 3% in all but two. Heck, even Jimmy Carter had some strong growth years." President Obama’s Growth Gap Hits $1.31 Trillion
a. "The years since 2007 have been a macroeconomic disaster for the United States of a magnitude unprecedented since the Great Depression." Obama: Always Wrong, Never In Doubt
b. "....first president since Hoover to never have a single year above 3% GDP growth."Obama economy is 'amazing,' says hedge fund billionaire
13. According to the2016 Index of Economic Freedom, an annual publication by The Heritage Foundation, America’s economic freedom has tumbled. With losses of economic freedom in eight of the past nine years, the U.S. has tied its worst score ever, wiping out a decade of progress. Since early2009:
· Government spending has exploded, amounting to $29,867 per household in 2015.
· The national debt has risen to $125,000 for every tax filing household in America—a total over $18 trillion.
· The government takeover of health care is raising prices and disrupting markets.
· Bailouts and new government regulations have increased uncertainty, stifling investment and job creation. America’s Economic Freedom Has Rapidly Declined Under Obama
Let me know is can dispute any......any......of this.
Or....if you would like a couple dozen more examples of the ineptitude of Obama...and, yours as well.
tl;dr
Liar.
- Moderator
- #218
If that's even close to the truth nobody had a job under Bush:

Why wouldn't it be true? You think Obama would need to release obviously fraudulent employment numbers if the economy was good?
Nobody should get to retire anymore what with the budget. Soggy needs to get a job and contribute and stop being a "taker." All these "retired" leeches need to pick it up. (-:The BIG LIE
Fox Reports That 98,000,000 Americans Out Of Work
They are out of the workforce NOT out of work
So, how is one working but not in the workforce? How does one pull that off?
You are not working and have no intention of working
You are not "out of work"...you are "retired"
- Aug 4, 2009
- 280,973
- 140,149
- 2,300
Those terrible1%ers!!!!!
"Port Authority Beat Cop Earns $221,000
Dozens of PAPD officers earn more than $200,000 in 2011, thanks to overtime."
Port Authority Beat Cop Earns $221,000
That cop is not even close to being in the 1%
Similar threads
- Replies
- 29
- Views
- 464
- Replies
- 381
- Views
- 3K
- Replies
- 86
- Views
- 560
- Replies
- 131
- Views
- 2K
Latest Discussions
- Replies
- 35
- Views
- 414
- Replies
- 2K
- Views
- 67K
Forum List
-
-
-
-
-
Political Satire 8029
-
-
-
-
-
-
-
-
-
-
-
-
-
-
-
-
-
-
-
ObamaCare 781
-
-
-
-
-
-
-
-
-
-
-
Member Usernotes 468
-
-
-
-
-
-
-
-
-
-