threegoofs
VIP Member
- Sep 4, 2015
- 309
- 37
- 66
Simple! Because he looks like an amateur compared to me!On what do you base your charge that he is paid to be here?
The clowning was swift and complete!
Follow along with the video below to see how to install our site as a web app on your home screen.

Note: This feature currently requires accessing the site using the built-in Safari browser.
Simple! Because he looks like an amateur compared to me!On what do you base your charge that he is paid to be here?
yep we're smart enough to see a professional troll hired in an effort to infect a forum. But, that won't happen here I can tell you that. Tactics are challenged here and your pure avoidance is classic troll.Again, thanks for noting my professional demeanor and skills. Glad it comes across so well.Don't waste your time Ian. threeturds is a troll and will never be anything but a troll. I have shown him plenty of links that refute his propaganda and he ignores everything.
in other words he's a paid propagandist who is here to talk AT people. Not with people.
The 'plenty of links' are vomitus from denier blogs. Not science. It's like someone showing me creationist links and telling me it disproves human evolution.
Thanks again. I know you must think rational argumentation must be done by a professional.yep we're smart enough to see a professional troll hired in an effort to infect a forum. But, that won't happen here I can tell you that. Tactics are challenged here and your pure lack of avoidance is classic troll.Again, thanks for noting my professional demeanor and skills. Glad it comes across so well.Don't waste your time Ian. threeturds is a troll and will never be anything but a troll. I have shown him plenty of links that refute his propaganda and he ignores everything.
in other words he's a paid propagandist who is here to talk AT people. Not with people.
The 'plenty of links' are vomitus from denier blogs. Not science. It's like someone showing me creationist links and telling me it disproves human evolution.
never had the need to solicit it. I have a career. As such, learned how to rationalize and think for myself and promote myself so I could hold onto the job in the same company for 39 years. I was an electronic engineer in the telecommunication industry and now am a manager.Thanks again. I know you must think rational argumentation must be done by a professional.yep we're smart enough to see a professional troll hired in an effort to infect a forum. But, that won't happen here I can tell you that. Tactics are challenged here and your pure lack of avoidance is classic troll.Again, thanks for noting my professional demeanor and skills. Glad it comes across so well.Don't waste your time Ian. threeturds is a troll and will never be anything but a troll. I have shown him plenty of links that refute his propaganda and he ignores everything.
in other words he's a paid propagandist who is here to talk AT people. Not with people.
The 'plenty of links' are vomitus from denier blogs. Not science. It's like someone showing me creationist links and telling me it disproves human evolution.
Are you jealous that you know no one would ever pay you for your irrational posting?
exactly. As long as there is money there will be accusations of global warming. End the money, and the global warming lies will stop. Funny how scientists who aren't funded by government never claim global warming is real.Much like the AGWCult itself, once we cut their funding, you'd see the posters advocating for it almost totally disappear
Well I read it. It seemed to be a graph of the output of instruments that were apples, oranges, and bananas put together. What puzzles me is the factor of 2 difference between the old and new models. The authors cavalierly mention it in the figure caption but nowhere else. I couldn't find any discussion of why there was a difference. Or maybe I missed it, and maybe I don't understand exactly how they got there.Bump for Wuwei. I especially like post #82
Well I read it. It seemed to be a graph of the output of instruments that were apples, oranges, and bananas put together. What puzzles me is the factor of 2 difference between the old and new models. The authors cavalierly mention it in the figure caption but nowhere else. I couldn't find any discussion of why there was a difference. Or maybe I missed it, and maybe I don't understand exactly how they got there.Bump for Wuwei. I especially like post #82
What I found amusing is their last paragraph:
Finally, it should be noted that whereas these analyses are useful for quantifying some aspects of temperature sensitivity, they are poorly suited to determine the extent to which the records reflect long-term (centuries to millennia) changes in past temperature, or the stability of the modern relation back through time.That paragraph seemed to say that the paper they authored is pointless, but maybe I'm being too harsh.
I did look at your second reference and of course I didn't realize the graph was inverted. Embarrassing. It is hard to see that they were dishonest. It seems more like an oversight. Sort of like the Mars lander that crashed because one contractor used the metric system and another used the english system of measurements.
Hey crick- there has been lots more discussion over at Climate Audit on the type of proxies used in Pages2K, their strengths and weaknesses, the methodologies, and comparisons to other papers done in the field.
It strikes me as a bit cowardly on your part that you won't even read about what may be wrong. If nothing else you would at least find out what proxies are being used.
On what do you base your charge that he is paid to be here?
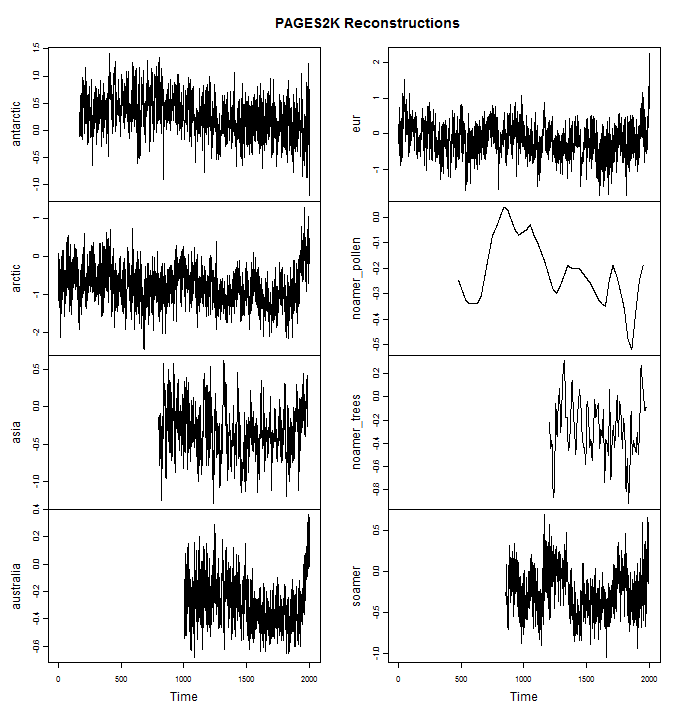

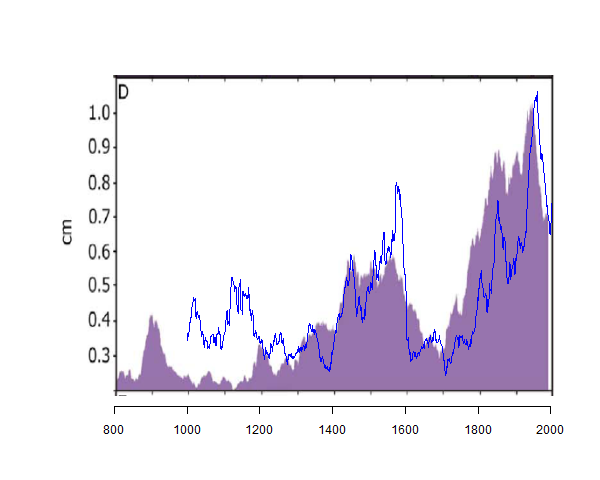
Figure 1. Varve thickness (mm). Purple – Hvítárvatn from Miller et al 2012 Figure 2D; blue – Big Round Lake (NCDC sheet 7 column 4) 30-year running mean. Both shown on same mm scale
to recap this thread-
PAGES2K is used by IPCC AR5 to show recent warming is greater than the MWP
only Arctic and Australia show higher recent values than MWP. europe is supposed to be the only place the MWP happened but doesnt show it. Australia is based on the flawed Gergis paper that was withdrawn. that leaves the Arctic.
Kaufman, under pressure, admits to using a proxy upsidedown, Hvitarvatn. here is his graph showing the difference.
the bottom graph shows both versions, both in degrees C, BUT WITH DIFFERENT SCALES!!!! what's up with that??? obfuscation much? there is a 0.5C increase in the MWP and a tenth or so decrease in the LIA.
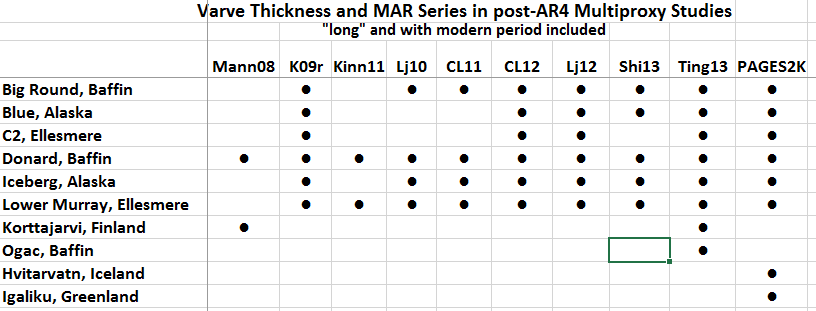
while it is good to see a mistake fixed, there is another near identical proxy still being used upsidedown
Figure 1. Varve thickness (mm). Purple – Hvítárvatn from Miller et al 2012 Figure 2D; blue – Big Round Lake (NCDC sheet 7 column 4) 30-year running mean. Both shown on same mm scale
it makes you wonder why he just didnt fix them both at the same time. I think I may have found out why.
wow, no wonder! if Hvítárvatn is fixed, it only changes PAGES2K. if Big Round, Baffin Island is changed it alters 8 out of 10 of the recent northern multiproxy reconstructions.
I can image poor Kaufman must have had his arm in a cast from being twisted behind his back so that he didnt screw everyone else up by admitting the more important error.
to recap this thread-
PAGES2K is used by IPCC AR5 to show recent warming is greater than the MWP
only Arctic and Australia show higher recent values than MWP. europe is supposed to be the only place the MWP happened but doesnt show it. Australia is based on the flawed Gergis paper that was withdrawn. that leaves the Arctic.
Kaufman, under pressure, admits to using a proxy upsidedown, Hvitarvatn. here is his graph showing the difference.
the bottom graph shows both versions, both in degrees C, BUT WITH DIFFERENT SCALES!!!! what's up with that??? obfuscation much? there is a 0.5C increase in the MWP and a tenth or so decrease in the LIA.
while it is good to see a mistake fixed, there is another near identical proxy still being used upsidedown
Figure 1. Varve thickness (mm). Purple – Hvítárvatn from Miller et al 2012 Figure 2D; blue – Big Round Lake (NCDC sheet 7 column 4) 30-year running mean. Both shown on same mm scale
it makes you wonder why he just didnt fix them both at the same time. I think I may have found out why.
wow, no wonder! if Hvítárvatn is fixed, it only changes PAGES2K. if Big Round, Baffin Island is changed it alters 8 out of 10 of the recent northern multiproxy reconstructions.
I can image poor Kaufman must have had his arm in a cast from being twisted behind his back so that he didnt screw everyone else up by admitting the more important error.
This is why PAL REVIEW is such a failure. His paper was PAL REVIEWED and not critically PEER REVIEWED by a multidisciplinary team. This is why they hate McIntyre, he is part of a multidisciplinary team which looks at the correct usage of the numbers. He shows their twisting of the fact to support an agenda. He exposes their lies and ANTI-SCIENCE (political science).
If you use the reconstructs properly our warming today is not even close to the RWP or MEWP. That would lay their game waste.
Hockeystick graphs are being "clawed back"? This is in AR5

that's impossible to be AR5 since they admitted a 15 year pause. Dude, holy crap can you read?Hockeystick graphs are being "clawed back"? This is in AR5


