- Banned
- #1
More On The NOAA Texas Temperature Fraud | The Deplorable Climate Science Blog
They do this type of fudging to every single data they get...
They do this type of fudging to every single data they get...
Follow along with the video below to see how to install our site as a web app on your home screen.

Note: This feature currently requires accessing the site using the built-in Safari browser.
Yappity yap yap. Your source is less credible than the National Enquirer.
If they are decreasing in Texas, that is one of the few places in the world where they are decreasing.
Up until the turn of the new millennium it was 'consensus science ' that SE USA was cooling.
Then adjustments and especially homogenization kicked in and replaced cooling with warming.
I have looked at a lot of stations in BEST and have not found any that still show cooling. Even though Muller admitted that 1/3 of all long term stations had cooling trends when he initiated BEST. Homogenization to meet 'expectations' has corrupted the temperature records.

The algorithms used in the temperature datasets are changing the records in ways that even the management probably don't understand.
As long as it produces favourable results they don't look too closely.
A while back I showed how the long term CET (Central England Temperature) records were being changed for values dating back sometimes hundreds of years ago. I don't think it was a human who decided to add or subtract 0.05C from eg 1765. It was the algorithm that 'corrects' recent readings and then recalculates past values accordingly.
Up until the turn of the new millennium it was 'consensus science ' that SE USA was cooling.
SE USA? It's still cooling. So what? Other regions are consistently warming faster than the rest of the world.
Then adjustments and especially homogenization kicked in and replaced cooling with warming.
So you've joined the conspiracy theorists Ian? Disappointing.
I have looked at a lot of stations in BEST and have not found any that still show cooling. Even though Muller admitted that 1/3 of all long term stations had cooling trends when he initiated BEST. Homogenization to meet 'expectations' has corrupted the temperature records.
Bullshit
http://www-users.york.ac.uk/~kdc3/papers/homogenization2015/homog.pdf
Homogenization of Temperature Data: An Assessment
Posted on 2 November 2015 by Kevin C
The homogenization of climate data is a process of calibrating old meteorological records, to remove spurious factors which have nothing to do with actual temperature change. It has been suggested that there might be a bias in the homogenization process, so I set out to reproduce the science for myself, from scratch. The results are presented in a new report: "Homogenization of Temperature Data: An Assessment".
Historical weather station records are a key source of information about temperature change over the last century. However the records were originally collected to track the big changes in weather from day to day, rather than small and gradual changes in climateover decades. Changes to the instruments and measurement practices introduce changes in the records which have nothing to do with climate.
On the whole these changes have only a modest impact on global temperature estimates. However if accurate local records or the best possible global record are required then the non-climate artefacts should be removed from the weather station records. This process is called homogenization.
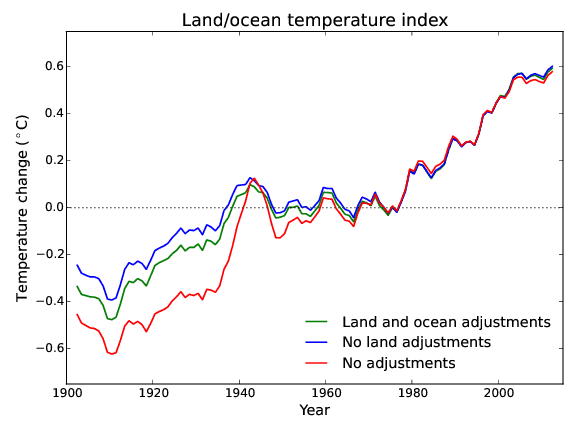
The validity of this process has been questioned in the public discourse on climate change, on the basis that the adjustments increase the warming trend in the data. This question is surprising in that sea surface temperatures play a larger role in determining global temperature than the weather station records, and are subject to a larger adjustments in the opposite direction (Figure 1). Furthermore, the adjustments have the biggest effect prior to 1980, and don't have much impact on recent warming trends.
View attachment 94273
[For those with trouble reading graphs - homogenization, over land or over land and sea, REDUCES warming observations over the 20th century --Abe (Crick)]
...
...
Conclusions
The report asks and attempts to answer a number of questions about temperature homogenization, summarized below (but note the new results described above).
- Are there inhomogeneities in the data?
Yes, there are.- Are those inhomogeneities of a form which would be explained by sporadic changes in the measuring apparatus or protocols?
Yes, the largest inhomogeneities are explained by sporadic changes in offset in the temperature readings.- Can those inhomogeneities be detected by comparing records from neighbouring stations?
Yes, most stations have other nearby stations with substantially similar records.- Is there sufficient redundancy in the data to allow those inhomogeneities to be corrected?
Yes, tests using multiple benchmark datasets suggest that inhomogeneities can be corrected.- Does the Global Historical Climatology Network (GHCN) method produce reasonable estimates of the size of the adjustments?
Yes, both neighbouring stations and reanalysis data support the GHCN adjustments- Do the observations support the presence of a trend in the homogenization adjustments?
Yes, both methods suggest that the adjustments should have a slightly skewed distribution.- Is there evidence that trend in the adjustments could be an artifact of the methods?
Two possible sources of bias in the method were tested and eliminated.- If the data are correctly homogenized, how large a change will be introduced in the global temperature trend?
The size of the required correction to the global record is much harder to determine than the direction. The simple methods described in this report cannot provide an absolute answer. The most I can say is that the GHCN correction looks plausible.
The algorithms used in the temperature datasets are changing the records in ways that even the management probably don't understand.
Which algorithms would that be and how did it change the records Ian? Substantiate your assertion.
As long as it produces favourable results they don't look too closely.
And you have evidence to back that up?
A while back I showed how the long term CET (Central England Temperature) records were being changed for values dating back sometimes hundreds of years ago. I don't think it was a human who decided to add or subtract 0.05C from eg 1765. It was the algorithm that 'corrects' recent readings and then recalculates past values accordingly.
Why don't you try replacing that isolated and uninformed "thinking" with the collection of factual data Ian?
Up until the turn of the new millennium it was 'consensus science ' that SE USA was cooling.
SE USA? It's still cooling. So what? Other regions are consistently warming faster than the rest of the world.
Then adjustments and especially homogenization kicked in and replaced cooling with warming.
So you've joined the conspiracy theorists Ian? Disappointing.
I have looked at a lot of stations in BEST and have not found any that still show cooling. Even though Muller admitted that 1/3 of all long term stations had cooling trends when he initiated BEST. Homogenization to meet 'expectations' has corrupted the temperature records.
Bullshit
http://www-users.york.ac.uk/~kdc3/papers/homogenization2015/homog.pdf
Homogenization of Temperature Data: An Assessment
Posted on 2 November 2015 by Kevin C
The homogenization of climate data is a process of calibrating old meteorological records, to remove spurious factors which have nothing to do with actual temperature change. It has been suggested that there might be a bias in the homogenization process, so I set out to reproduce the science for myself, from scratch. The results are presented in a new report: "Homogenization of Temperature Data: An Assessment".
Historical weather station records are a key source of information about temperature change over the last century. However the records were originally collected to track the big changes in weather from day to day, rather than small and gradual changes in climateover decades. Changes to the instruments and measurement practices introduce changes in the records which have nothing to do with climate.
On the whole these changes have only a modest impact on global temperature estimates. However if accurate local records or the best possible global record are required then the non-climate artefacts should be removed from the weather station records. This process is called homogenization.
The validity of this process has been questioned in the public discourse on climate change, on the basis that the adjustments increase the warming trend in the data. This question is surprising in that sea surface temperatures play a larger role in determining global temperature than the weather station records, and are subject to a larger adjustments in the opposite direction (Figure 1). Furthermore, the adjustments have the biggest effect prior to 1980, and don't have much impact on recent warming trends.
View attachment 94273
[For those with trouble reading graphs - homogenization, over land or over land and sea, REDUCES warming observations over the 20th century --Abe (Crick)]
...
...
Conclusions
The report asks and attempts to answer a number of questions about temperature homogenization, summarized below (but note the new results described above).
- Are there inhomogeneities in the data?
Yes, there are.- Are those inhomogeneities of a form which would be explained by sporadic changes in the measuring apparatus or protocols?
Yes, the largest inhomogeneities are explained by sporadic changes in offset in the temperature readings.- Can those inhomogeneities be detected by comparing records from neighbouring stations?
Yes, most stations have other nearby stations with substantially similar records.- Is there sufficient redundancy in the data to allow those inhomogeneities to be corrected?
Yes, tests using multiple benchmark datasets suggest that inhomogeneities can be corrected.- Does the Global Historical Climatology Network (GHCN) method produce reasonable estimates of the size of the adjustments?
Yes, both neighbouring stations and reanalysis data support the GHCN adjustments- Do the observations support the presence of a trend in the homogenization adjustments?
Yes, both methods suggest that the adjustments should have a slightly skewed distribution.- Is there evidence that trend in the adjustments could be an artifact of the methods?
Two possible sources of bias in the method were tested and eliminated.- If the data are correctly homogenized, how large a change will be introduced in the global temperature trend?
The size of the required correction to the global record is much harder to determine than the direction. The simple methods described in this report cannot provide an absolute answer. The most I can say is that the GHCN correction looks plausible.
The algorithms used in the temperature datasets are changing the records in ways that even the management probably don't understand.
Which algorithms would that be and how did it change the records Ian? Substantiate your assertion.
As long as it produces favourable results they don't look too closely.
And you have evidence to back that up?
A while back I showed how the long term CET (Central England Temperature) records were being changed for values dating back sometimes hundreds of years ago. I don't think it was a human who decided to add or subtract 0.05C from eg 1765. It was the algorithm that 'corrects' recent readings and then recalculates past values accordingly.
Why don't you try replacing that isolated and uninformed "thinking" with the collection of factual data Ian?
As the World Warms, Part of the American Southeast Cools
Does "global warming" mean it’s warming everywhere? | NOAA Climate.gov
https://www.sercc.com/ClimateoftheSoutheastUnitedStates.pdf
Cooling in Humid Climates via a High-Mass Evaporative System - GreenBuildingTalk - GreenBuildingTalk - Green Building Forums on Insulating Concrete Forms (ICF), Structural Insulated Panels (SIP), Radiant Heating, Geothermal Heat Pumps, Solar Power, Green Construction Projects - Green Building Technologies - Solar and Wind Power
Southeast Temperature | Climate Education Modules for K-12
Effects of Climate Change on the Southeast | Climate Education Modules for K-12
Sulfate-induced cooling in the southeastern U.S.: An observational assessment - Saxena - 1999 - Geophysical Research Letters - Wiley Online Library
It's not a huge secret Ian.

Have fun. That the US SE is not warming at the rate of the rest of the globe doesn't refute AGW. It is irrelevant to the question.
 ...when the readings don't fit the narrative, the religion pivots. That's why, of course, its now "climate change" and not global warming Now these bozo's are blaming bitterly cold NE winters on "climate change"
As the World Warms, Part of the American Southeast Cools
Does "global warming" mean it’s warming everywhere? | NOAA Climate.gov
https://www.sercc.com/ClimateoftheSoutheastUnitedStates.pdf
Cooling in Humid Climates via a High-Mass Evaporative System - GreenBuildingTalk - GreenBuildingTalk - Green Building Forums on Insulating Concrete Forms (ICF), Structural Insulated Panels (SIP), Radiant Heating, Geothermal Heat Pumps, Solar Power, Green Construction Projects - Green Building Technologies - Solar and Wind Power
Southeast Temperature | Climate Education Modules for K-12
Effects of Climate Change on the Southeast | Climate Education Modules for K-12
Sulfate-induced cooling in the southeastern U.S.: An observational assessment - Saxena - 1999 - Geophysical Research Letters - Wiley Online Library
It's not a huge secret Ian.
Link number one-computer models.
Link number two-OPINION
Link number three-OPINION based on computer models
Link number four-A nice discussion about air conditioners. Actually had some factual information. How refreshing.
Link number five-Computer models.
Link number six-OPINION
Link number seven-Computer models and some actual empirical data. The empirical shows cooling from sulfates. Something we've known about for decades, but at least it was factual. Unlike the warming nonsense you post.
Your abject fear of models would be laughable were it not so-o-o-o-o fucking pathetic.
As the World Warms, Part of the American Southeast Cools
Does "global warming" mean it’s warming everywhere? | NOAA Climate.gov
https://www.sercc.com/ClimateoftheSoutheastUnitedStates.pdf
Cooling in Humid Climates via a High-Mass Evaporative System - GreenBuildingTalk - GreenBuildingTalk - Green Building Forums on Insulating Concrete Forms (ICF), Structural Insulated Panels (SIP), Radiant Heating, Geothermal Heat Pumps, Solar Power, Green Construction Projects - Green Building Technologies - Solar and Wind Power
Southeast Temperature | Climate Education Modules for K-12
Effects of Climate Change on the Southeast | Climate Education Modules for K-12
Sulfate-induced cooling in the southeastern U.S.: An observational assessment - Saxena - 1999 - Geophysical Research Letters - Wiley Online Library
It's not a huge secret Ian.
Link number one-computer models.
Link number two-OPINION
Link number three-OPINION based on computer models
Link number four-A nice discussion about air conditioners. Actually had some factual information. How refreshing.
Link number five-Computer models.
Link number six-OPINION
Link number seven-Computer models and some actual empirical data. The empirical shows cooling from sulfates. Something we've known about for decades, but at least it was factual. Unlike the warming nonsense you post.
You're stupid and you lie. No one is running models to see what the temps in the US SE were over the last 20 years. Besides, that such articles exist is all the proof required that the temperatures in the US SE are common knowledge.
Your abject fear of models would be laughable were it not so-o-o-o-o fucking pathetic.
