Economy Still In Bad Shape. New Homes Sales Lowest In History

mudwhistle

Diamond Member
Gold Supporting Member
Jul 21, 2009
130,116
66,213
2,645
Headmaster's Office, Hogwarts
new-home-sales-history-per-million.png


WASHINGTON - The sluggish U.S. economy produced mixed signals Thursday about how fast it is advancing.

The U.S. government reported that orders for durable goods, those designed to last at least three years, surged three percent in December, suggesting that manufacturing is a strong segment of the national economy. Orders for cars, commercial airplanes, machinery, communications equipment and primary metals fueled the increase, the second straight monthly gain.

But two other reports depicted a more negative snapshot of the U.S. economy.

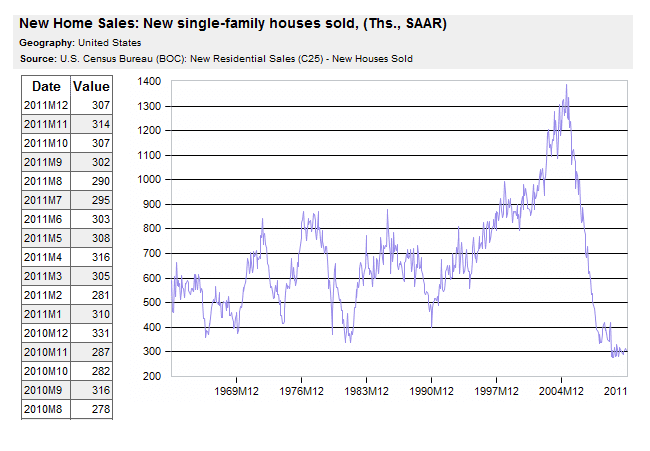
The Commerce Department said the number of new-home sales in the country was the lowest ever in 2011, based on records dating back to 1963. It said 302,000 new homes were sold last year, well less than half the 700,000 figure that economists say would represent a healthy economy.

Millions of homeowners in the U.S. have lost their homes to foreclosures when they lost their jobs and were unable to keep paying their home loans. The glut of houses for sale has pushed down prices, but stricter lending requirements have curtailed the number of buyers who qualify for new loans. Sales of existing houses, often cheaper than prices on comparable new homes, have increased in recent months.

In a third report, the government said that the number of U.S. workers making their initial claims for jobless aid increased by 21,000 last week to 377,000, after falling to a nearly four-year low the previous week. New applications for unemployment assistance have steadily fallen in recent months, averaging about the same number as last week’s total.

But economists say that the 8.5 percent national unemployment rate will not decrease much until the number of new requests for jobless aid falls consistently below 375,000, to signal that hiring has picked up. About 13 million U.S. workers are unemployed. While the labor market has improved in recent months, the country has struggled to replace the 8.7 million jobs lost during the recession from 2007 to 2009, the worst in the U.S. since the 1930s.

The country’s central bank, the Federal Reserve, announced Wednesday that it is keeping its benchmark lending rate near zero through late 2014, its latest attempt at boosting the national economy. At the same time, however, it trimmed its projection for the U.S. economy this year, saying that it may only advance by as much as 2.7 percent, down from an earlier 2.9 percent prediction.

Case-Shiller-UPDATED.png


Links

US New Home Sales Lowest In History
 
Chairman Ben S. Bernanke said the Federal Reserve is considering additional asset purchases to boost growth after extending its pledge to keep interest rates low through at least late 2014.

Policy makers are “prepared to provide further monetary accommodation if employment is not making sufficient progress towards our assessment of its maximum level, or if inflation shows signs of moving further below its mandate-consistent rate,” Bernanke said at a news conference today after a Federal Open Market Committee meeting in Washington. Bond buying is “an option that’s certainly on the table.”

Stocks and Treasuries rose after the Fed extended its previous pledge to keep borrowing costs low at least until the middle of 2013. Fed officials lowered their forecasts for economic growth and price increases this year and in 2013 and set a long-term goal of 2 percent inflation.

“What they’re doing is setting the table for some sort of additional monetary easing,” said Scott Minerd, chief investment officer in Santa Monica, California for Guggenheim Partners LLC. “The changes in the statement from last month de- emphasize growth.”


This means more Quantitative Easing and more unrecorded inflation.......and more shrinking of the dollar until after the election at least.
 
If only that were the only issue, though lord knows it's a serious one. The problems are myriad and do not spell recovery any time soon. Lots of links follow at the sites:

Fed Won't Admit it - But QE3 is Already in Force - Yahoo! Finance

Fed Won't Admit it - But QE3 is Already in Force
ETFguideBy Simon Maierhofer | ETFguide – Fri, Jan 27, 2012

The Fed telling us there is no QE3 is like a vegetarian eating short-rib ravioli or pork eggrolls. Just because you can't 'see' it doesn't mean it's not there.

True, there is no QE3 (yet) in the form of QE1 or QE2. QE stands for quantitative easing and quantitative easing happens when a central bank buys financial assets to inject money into the economy.

Even though it's not called QE3, the Fed is right now making billions of dollars available to buy financial instruments. We're not talking about Operation Twist here; we're talking about a covert operation that's essentially a U.S. bailout of Europe.

Covert Doesn't Mean it Doesn't Exist

You probably heard of the 'temporary U.S. dollar liquidity swap arrangement.' This arrangement, which the Federal Reserve has with the European and other central banks, sounds innocent enough.

Before we go on, keep in mind that the European Central Bank's (ECB) constitution does not allow the ECB to print money and use it to buy government bonds (such as Greece, Italy, Spain, Portugal, etc.).

The dollar swap agreement with the Fed however, allows the ECB to circumvent its constitutional prohibition to buy extensive amounts of European debt. The Federal Reserve acts almost as a money launderer and helps the ECB to keep face. The 'benefit' of buying bonds from struggling governments is that it keeps interest rates low and manageable.

How Does it Work?

Why doesn't the Fed just lend money directly to U.S. branches of foreign banks? For one, the Fed's gotten embarrassed by the 'secret' files showing its prior largess with foreign banks. Also, it doesn't want the debt of foreign banks on its books (at least not officially).

Which European government wouldn't want the ECB to bail out Europe? The ECB covertly does what political leaders want it to do and political leaders won't cry foul. It's easy to look the other way when there's a unanimous consent.

Instead of engaging in an official version of euro-QE, the ECB borrows money from the Federal Reserve and lends it to euro banks. Banks in turn are urged to buy European government bonds.

It's a great deal for European banks (at least at first) because they pocket bond returns north of 4% and get the loan on the cheap (1%). The ECB or Fed will no doubt cover any defaults, so it's a risk free margin.

What's the Scope?

In addition to the money shipped to Europe from the U.S., European banks can count on unlimited three-year, 1% loans from the ECB. In December, banks borrowed $638 billion from the ECB.

The dollar swap agreement doesn't get much attention here, but Germany's Frankfurter Allgemeine newspaper reported that euro banks took three-month credits worth $33 billion, which was financed by a swap agreement between the Fed and ECB. ...

Yeah, here's more from an econ professor at Yale:

http://finance.yahoo.com/blogs/daily...170501261.html

...BLODGET: Thanks for doing this, Steve. Great to see you. So where are we in the world economy these days?

ROACH: Japanese-like outcomes in the developed world, from Japan in its third lost decade to stagnation in the U.S. to recession in Europe. And I say Japanese-like because these are not temporary slowdowns. They are going to be lasting because of the damage done during these massive credit, property — and in the case of Europe — currency and interest rate bubbles for Southern European economies.

BLODGET: Is there anything that can be done to change this or is it just a matter of time?

ROACH: It is going to take really aggressive structural policies aimed at changing behavior rather than the big bazooka of monetary and fiscal stimulus, which the authorities have embraced as an answer to a crisis. I think what we found in '08 and '09 is that aggressive monetary and fiscal stimulus can stop the crisis but it can't spark a sustainable recovery. There's no traction when you're in a 'liquidity trap' when interest rates are too low and debt loads are too high to get real actors in the economy to respond.

BLODGET: And when you draw the Japan comparison, do you really think it's 20-plus years for the U.S.?

ROACH: I don't know, I honestly don't know. But one of the great courses I'm teaching at Yale is called "The Lessons of Japan." You spend five weeks studying what happened in Japan and developing metrics to calibrate the excesses pre-bubble, the mistakes made post-bubble, and then we look at that template relative to other countries in the developed and developing world and there's a lot of striking similarities. Especially insofar as the U.S. and Europe let these bubbles and policy blunders distort the real side of their economy. It would be one thing if these were just financial or market-driven excesses. But they're not....

2011 GDP: 1.7%
...From the just-released GDP report:

Real GDP increased 1.7 percent in 2011 (that is, from the 2010 annual level to the 2011 annual level), compared with an increase of 3.0 percent in 2010.

The increase in real GDP in 2011 primarily reflected positive contributions from personal consumption expenditures (PCE), exports, and nonresidential fixed investment that were partly offset by negative contributions from state and local government spending, private inventory investment, and federal government spending. Imports, which are a subtraction in the calculation of GDP, increased.

Not exactly a barnburner.
http://www.bloomberg.com/news/2011-1...op-europe.html
Household Wealth Falls for Second Straight Quarter
By Timothy R. Homan

Household wealth in the U.S. fell from July through September for a second straight quarter as the European debt crisis depressed stocks and home values decreased.

Net worth for households and non-profit groups decreased by $2.45 trillion to $57.4 trillion, the Federal Reserve said today in its flow of funds report from Washington. Americans reduced debt in the third quarter, extending a string of declines dating back three years.

A 14 percent slump in the Standard & Poor’s 500 Index, the worst quarter since 2008, combined with another decrease in households’ real estate values in the third quarter. A rebound in stocks at the end of this year and slower home-price declines may help stabilize Americans’ balance sheets at the same time employment growth picks up. ...
 
However, the press will continue to ignore the bad news and will search for a silver-lining in every report....using "unexpectedly" often in their reporting.

It's clear that things are not getting better, but Obama needs a good economy, and since he can't produce one, he's going act like it's better......and the media will back him up 200%.
 
There's a difference between a losing investment and a market collapse and homes now are in a market collapse. We don't know if we've hit the bottom not because we don't know which direction homes are headed but because there are so many sellers and so few buyers that we don't know where home values should rightly be placed.

This is bad.

Assuming we can trust the numbers presented in the chart, home valuations don't look materially different than stock valuations, historically. Move the market a year or 2 in one direction and instead of "buying high", put "selling low" and the DJIA looks similar to home values.

One big difference is that every economic policy over the last 3 years has been designed to prop up the DJIA - Eff the homeowners. Oh wait - let me remember - the value of homes only matters to subprimer CRA people, right? It doesn't affect you and me......

Right?
 
...we don't know where home values should rightly be placed. This is bad. Assuming we can trust the numbers presented in the chart, home valuations ...
We don't have to assume any such thing because anyone who wants can look and think for himself. That home sales graph shows annual numbers ending two years ago. Here're the month stats ending last month:
homesale.png

--so what we got is home sales stopped falling over a year ago and they bottomed out because of a two decade sales glut. The proprietary home price index plot is some clown's opaque fudging to grab tenure through politics. Here's the Fed's home price index devided by the CPI--
homeprice.png

--showing once again that things have bottomed out and have been basing.
 

Forum List

Back
Top