- Apr 10, 2013
- 23,667
- 1,880
- 265
Living Paycheck to Paycheck is a Way of Life for 8 of 10 Full Time U.S. Workers, According to New CareerBuilder Survey. Study Highlights:
- 78 percent of U.S. workers live paycheck to paycheck to make ends meet.
- More than 1 in 4 workers do not set aside any savings each month.
- Nearly 3 in 4 workers say they are in debt today.
- More than half of workers think they will always be in debt.
- More than half of minimum wage workers say they have to work more than one job to make ends meet.
Thanks Obama!
Obama pushed to raise the minimum wage which Republicans nixed.
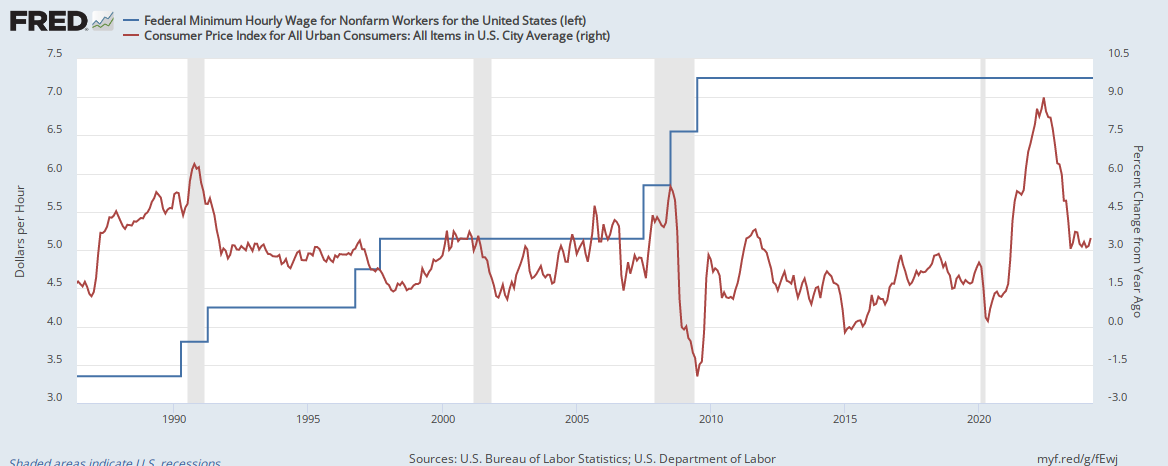
How about because raising the minimum wage is like a dog chasing it's tail. As wages go up, prices go up. As prices go up, we have to raise the minimum wage again. Then prices go up again.
Ever see a dog catch his tail? Neither have I!
As we've already debated on the USMB; Arizona raised the State minimum wage, prices haven't risen, and they went from number 3 to number 10 in poverty level.