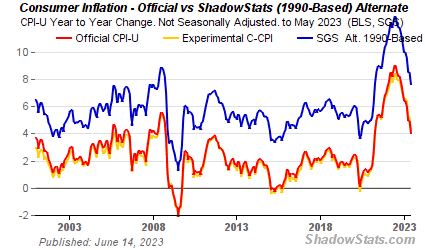
Current inflation doesn't ..

zonly1

Probie still throwin'em
Jun 6, 2010
1,255
152
48
on the map
count energy and food. As gas goes up, no rocket science, so does the cost of process foods including field grown crops and orchards and of course dryland farming, manufactured goods and services..tnc.
 
Last edited:
That's a lie.

Common Misconceptions about the Consumer Price Index: Questions and Answers

"Has the BLS removed food or energy prices in its official measure of inflation?

No. The BLS publishes thousands of CPI indexes each month, including the headline All Items CPI for All Urban Consumers (CPI-U) and the CPI-U for All Items Less Food and Energy. The latter series, widely referred to as the "core" CPI, is closely watched by many economic analysts and policymakers under the belief that food and energy prices are volatile and are subject to price shocks that cannot be damped through monetary policy. However, all consumer goods and services, including food and energy, are represented in the headline CPI.

Most importantly, none of the prominent legislated uses of the CPI excludes food and energy. Social security and federal retirement benefits are updated each year for inflation by the All Items CPI for Urban Wage Earners and Clerical Workers (CPI-W). Individual income tax parameters and Treasury Inflation-Protected Securities (TIPS) returns are based on the All Items CPI-U.
"
 
Last edited:
I find that my personal expeience and the CPI seldom jibe.

That is, I suspect the experience of most Americans.

So if the CPI is an accurate picture of the consumer expeience, I don't know who those consumers are.

Certainly it isn't my experience or that of anybody else I know.
 
I find that my personal expeience and the CPI seldom jibe.

That is, I suspect the experience of most Americans.

So if the CPI is an accurate picture of the consumer expeience, I don't know who those consumers are.

Certainly it isn't my experience or that of anybody else I know.

Your perception isn't exactly a good indicator of what's happening in reality. It's prone to all sorts of involuntary biases. If you've actually taken the time to define your basket of consumer goods and recorded all of their prices every week and formed an index which you could compare to the CPI, then there'd be some degree of rigor such claims.
 
Last edited:
Yeah - It's a little ridiculous that the Fed says inflation is only 2 percent a year... my milk, gas and bread have gone up way more than that. The average American sees about a 9 percent inflation rate. My pay hasn't increased that much though! It's sad when I actually was able to save more 10 years ago than I can now even though I've gotten raises over the years. Just goes to show you how much inflation can really hurt the middle class. Damn fiat money and intentional debasing of the U.S. dollar.
 
Yeah - It's a little ridiculous that the Fed says inflation is only 2 percent a year... my milk, gas and bread have gone up way more than that. The average American sees about a 9 percent inflation rate.

Well that's bullshit. Inflation at 9% per year means that over a period of ten years prices increase by a factor of 2.37. Do you honestly think everything is over twice as expensive as it was ten years ago? Fair enough for energy, right. But, I don't know, maybe it's conceivable that a highly demanded globally traded commodity like oil might undergo price shocks not caused by monetary policy? I like that everybody perceives much more inflation than there actually is but nobody bothers with an actual data.

From the 2012 Statistical Abstract: The average price of white bread in 2000 was $0.99. The average price in 2010 was $1.39. So that's an annual bread-inflation rate of about 3.5%

The average price of a gallon of fresh whole milk in 2000 was $2.79. In 2010 it was $3.32. That's an annual milk-inflation rate of about 1.8%.

Your 9% figure is full of shit.

My pay hasn't increased that much though!

Well that was your first hint that your figure was off. Either there have been massive supply shocks to everything causing their price to rise 9% without corresponding increases in wages, or your guess is wrong. One of the best estimates for the money supply-induced inflation rate is the rate of wage inflation. That is, how quickly your wages are going up.
 
I find that my personal expeience and the CPI seldom jibe.

That is, I suspect the experience of most Americans.

So if the CPI is an accurate picture of the consumer expeience, I don't know who those consumers are.

Certainly it isn't my experience or that of anybody else I know.

Your perception isn't exactly a good indicator of what's happening in reality. It's prone to all sorts of involuntary biases. If you've actually taken the time to define your basket of consumer goods and recorded all of their prices every week and formed an index which you could compare to the CPI, then there'd be some degree of rigor such claims.


I essantially buy the same products week after week.

The problem as I see it is this...

The CPIs basket of goods is screwed up.

The CPIs basket of goods doesn't really reflect the same basket of goods that most people typically buy on a regular basis.

There really ought to be multiple CPI rates.

Each CPI number would better reflect the pattern of buying of the various CLASSES of consumers.

For instance the basket of goods for the very poor would mostly entirely include food shelter and clothing and pretty much NOTHING else.

The basket of goods for the upperclass consumers would reflect the sorts of goods that they purchase.

Those two baskets are very different, so one CPI cannot actually reflect the INFLATION experience of the different consumer classes.

You see my point, DSGE?


a 5% increse in the privce of gas and oil, for example, impact the lower class' CPI much much differently than they impact the upper classes,

Why?

Because the nature of the percentage of their incomes going to BUY those goods is very different.

You understand the math, I am sure.

So the question isn't:

Is the CPI real?

instead the question is:

For whom, is the CPI real?

My answer is that it isn't really real for MOST Americans.

For most Americans the CPI is sytematically UNDERSTATED.
 
Last edited:
I find that my personal expeience and the CPI seldom jibe.

That is, I suspect the experience of most Americans.

So if the CPI is an accurate picture of the consumer expeience, I don't know who those consumers are.

Certainly it isn't my experience or that of anybody else I know.

Your perception isn't exactly a good indicator of what's happening in reality. It's prone to all sorts of involuntary biases. If you've actually taken the time to define your basket of consumer goods and recorded all of their prices every week and formed an index which you could compare to the CPI, then there'd be some degree of rigor such claims.


I essantially buy the same products week after week.

The problem as I see it is this...

The CPIs basket of goods is screwed up.

The CPIs basket of goods doesn't really reflect the same basket of goods that most people typically buy on a regular basis.

There really ought to be multiple CPI rates.

Each CPI number would better reflect the pattern of buying of the various CLASSES of consumers.

For instance the basket of goods for the very poor would mostly entirely include food shelter and clothing and pretty much NOTHING else.

The basket of goods for the upperclass consumers would reflect the sorts of goods that they purchase.

Those two baskets are very different, so one CPI cannot actually reflect the INFLATION experience of the different consumer classes.

You see my point, DSGE?

Absolutely. The BLS admit as such on their CPI FAQ. At some point they ran experimental indexes for the elderly and the poor. If I recall, they didn't get updated much because collecting the data on different sub-population's spending patterns was too expensive or something. But I understand and agree with that point.

For most Americans the CPI is sytematically UNDERSTATED.

I don't agree with this bit though. The CPI-U estimates a price index for the average urban consumer.
 
Your perception isn't exactly a good indicator of what's happening in reality. It's prone to all sorts of involuntary biases. If you've actually taken the time to define your basket of consumer goods and recorded all of their prices every week and formed an index which you could compare to the CPI, then there'd be some degree of rigor such claims.


I essantially buy the same products week after week.

The problem as I see it is this...

The CPIs basket of goods is screwed up.

The CPIs basket of goods doesn't really reflect the same basket of goods that most people typically buy on a regular basis.

There really ought to be multiple CPI rates.

Each CPI number would better reflect the pattern of buying of the various CLASSES of consumers.

For instance the basket of goods for the very poor would mostly entirely include food shelter and clothing and pretty much NOTHING else.

The basket of goods for the upperclass consumers would reflect the sorts of goods that they purchase.

Those two baskets are very different, so one CPI cannot actually reflect the INFLATION experience of the different consumer classes.

You see my point, DSGE?

Absolutely. The BLS admit as such on their CPI FAQ. At some point they ran experimental indexes for the elderly and the poor. If I recall, they didn't get updated much because collecting the data on different sub-population's spending patterns was too expensive or something. But I understand and agree with that point.

For most Americans the CPI is sytematically UNDERSTATED.

First of all thank you acknowledging my point regarding having what I think is is a mistake --- e.g. reporting only one CPI.

It's rare on this board when people will grant one another a point made.

I don't agree with this bit though. The CPI-U estimates a price index for the average urban consumer.


The average uban consumer is in fact much weathier than the median average American family, I suspect.

There really is no such thing as an average (that reflect reality) when there are such huge differences in incomes (and hence spending patterns).

AS to it being too much trouble to have say 5 CPIs?

That is pure nonsense.

The majority of the cost would be in setting up a 5 theoretical CPI baskets of goods.

After those theoretical baskets of goods sytem is set up?

The cost of adminisistering it would be minescule.

Why don't we do this, really?

Beccause by under reporting CPI (like we do for most Americans) Social Security COLAs and many other systems with COLAs end up cost less money, that's why.
 
AS to it being too much trouble to have say 5 CPIs?

That is pure nonsense.

The majority of the cost would be in setting up a 5 theoretical CPI baskets of goods.

After those theoretical baskets of goods sytem is set up?

The cost of adminisistering it would be minescule.

Why don't we do this, really?

For several reasons. Collection would become more difficult if you add in rural areas. Already hundreds of BLS employees physically visit stores every month to collect prices. Adding in a larger area to cover, including longer travel times and time to collect would involve substantial costs.

And not just collection area, but the number of outlets...while the current sample size is fine for a National city average, it's not adequate for multiple sub groups. One of the reasons the CPI-E has remained experimental is the sub sample of eldery is small enough that the EPI loses a lot of accuracy.

To expand to rural areas and to have large enough sub-samples to adequately represent the smaller groups would be a large cost in adding people to collect and travel expenses. That's not even talking about the possibility of needing more analysts in DC to cover the increased sample size. And given the short amount of time (3 weeks) to compile the multiple indexes already in existence, you'd run into problems of timeliness as well.

The main reason the CPI will never match an individual's experience is that the CPI is an AVERAGE of all urban consumers. The weights are set for average expenditures and that's hardly going to match personal experience. My child care costs are much more of my budget than their weight in the CPI. And the CPI has to include some big ticket items, like cars, computers, appliances, that people don't buy every month....but every month someone buys them, so that's part of average price changes.
 
Last edited:
As the price of oil goes up so does the cost of maintaining and building roads.
However the cost is a flat tax per gallon.
Gas tax should be a percentage of the price tax so it will pay for our road repairs and construction.

this is a conservative viewpoint.
Unless you want some other tax to pay for road repairs?
 
AS to it being too much trouble to have say 5 CPIs?

That is pure nonsense.

The majority of the cost would be in setting up a 5 theoretical CPI baskets of goods.

After those theoretical baskets of goods sytem is set up?

The cost of adminisistering it would be minescule.

Why don't we do this, really?

For several reasons. Collection would become more difficult if you add in rural areas. Already hundreds of BLS employees physically visit stores every month to collect prices. Adding in a larger area to cover, including longer travel times and time to collect would involve substantial costs.

I guess we're just going to have to agree to disagree on the above point. DEFINE "SUBSTANTIAL" for us.

Will it cost a million dollars a month more? Peanuts.

Plus I don't think it will require a lot more people to get pricing, either.

The same number of people will collect the same amount of pricing data, just as they have been doing all along.

But what is done with that data will change.

That data will be computed though the various CPI modelsa and that can be done cheaply since it is all done by computer.

Once the multiple CPI models are set up com[puting the multiple CPI stats would take SECONDS.


And not just collection area, but the number of outlets...while the current sample size is fine for a National city average, it's not adequate for multiple sub groups. One of the reasons the CPI-E has remained experimental is the sub sample of eldery is small enough that the EPI loses a lot of accuracy.

No none of that is necessary. We don't need more data, we need more MODELS to run that data through.


To expand to rural areas and to have large enough sub-samples to adequately represent the smaller groups would be a large cost in adding people to collect and travel expenses. That's not even talking about the possibility of needing more analysts in DC to cover the increased sample size. And given the short amount of time (3 weeks) to compile the multiple indexes already in existence, you'd run into problems of timeliness as well.

The main reason the CPI will never match an individual's experience is that the CPI is an AVERAGE of all urban consumers. The weights are set for average expenditures and that's hardly going to match personal experience. My child care costs are much more of my budget than their weight in the CPI. And the CPI has to include some big ticket items, like cars, computers, appliances, that people don't buy every month....but every month someone buys them, so that's part of average price changes.

You know, you're addressing my objections as though I have no clue how CPI is currently being computed.

And your theory that we'd need to collect more data collection is just plain old wrong.

Using exactly the same data collection system we could compute different CPI stats based on the more typical market baskets purchased by the very different buying patterns of the different socio-economic populations

It's the market basket MODELING that needs to change, not the amount of data computed.
 
[ guess we're just going to have to agree to disagree on the above point. DEFINE "SUBSTANTIAL" for us.

Will it cost a million dollars a month more? Peanuts.
The total budget for the Office of Prices and Living Conditions (CPI, PPI, IPP, and Consumer Expenditure surveys) is $211,084,000 for 2013. 12 million more just to the CPI is substantial.

Plus I don't think it will require a lot more people to get pricing, either.

The same number of people will collect the same amount of pricing data, just as they have been doing all along.

But what is done with that data will change.

Depending on the exact changes you have in mind, yes, more data...a lot more data would be necessary. Adding rural areas would have to be very expensive as you would need proportionately more outlets and prices for the same number of people. In urban areas, because of population density, you can make do with smaller samples, but to cover the territory of rural areas, you would need to increase collection.


That data will be computed though the various CPI modelsa and that can be done cheaply since it is all done by computer.

Once the multiple CPI models are set up com[puting the multiple CPI stats would take SECONDS.
If no extra collection would be necessary (again, depending on what you're after), you'd have to figure the greater errors introduced by using a smaller sub-sample. Again, that's an issue with the CPI-E and one of the reasons it's still experimental...the accuracy isn't there.

No none of that is necessary. We don't need more data, we need more MODELS to run that data through.
Why don't you think more data would be needed to measure things not already measured?


You know, you're addressing my objections as though I have no clue how CPI is currently being computed.
I have no idea what your knowledge is, though I'm confident mine is greater since I've worked as a CPI analyst (many years ago) and still meet regularly with CPI staff to discuss these issues.

And your theory that we'd need to collect more data collection is just plain old wrong.

Using exactly the same data collection system we could compute different CPI stats based on the more typical market baskets purchased by the very different buying patterns of the different socio-economic populations
And you need the data on those buying patterns from the Consumer Expenditure Survey and the Telephone Point of Purchase Survey. That is not as simple as you seem to believe.


It's the market basket MODELING that needs to change, not the amount of data computed.

If you don't have the right DATA, the model will be useless.

If you want a different look, or a different index from the hundreds already published, you can always do the math yourself: Math calculations to better utilize CPI data I mean, that's basically what BEA does in constructing the PCE, though they have better access to the raw data.

You can actually purchase the micro-data for the Consumer Expenditure Survey from BLS.

But basically, there's not enough interest or demand to make the changes you're suggesting on top of the large number of indexes already published.
 
Does anyone know about the metrics of john williams?

He ends up in vastly different numbers than the CPI. I think it has to do with hedonic adjustments but dont really know.

I cant really comment as I have no clue. But getting inflation number right is vital to getting other numbers right.

Anyway here is the shadow stats numbers:

alt-cpi-home2.gif


I am just interested what they count so differently to get different numbers.
 
Using exactly the same data collection system we could compute different CPI stats based on the more typical market baskets purchased by the very different buying patterns of the different socio-economic populations

We can use the same pricing data. The basket is huge and will stay the same, and all the prices will stay the same. What changes when you want to calculate an index for a sub-group of the population is the weights attached to items in the basket.

The weights on items in the basket are found by taking averages from the Consumer Expenditure Survey. Over each year 7000 people are given diaries to record their expenditures over a two week period, and each quarter 7000 people are interviewed five times each over the quarter. They need this much data to form accurate estimates of population parameters.

So you can't just take a minority sub-population, like the elderly or the very poor, and use the sample sub-population to estimate the whole sub-population. There just aren't enough people to form accurate estimators. If there's going to be a CPI for the elderly, we need to sample the expenditure habits of around 7000 elderly people per quarter. And the same applies for each subgroup we want to make an index for.

Crazy expensive.

Don't forget you'd have to redo the TPOPS as well. Not as expensive, but still an expense.

And there is a CPI for the elderly, but because the sample size is inadequate, it is still just experimental.
 
Does anyone know about the metrics of john williams?

He ends up in vastly different numbers than the CPI. I think it has to do with hedonic adjustments but dont really know.

I cant really comment as I have no clue. But getting inflation number right is vital to getting other numbers right.

Anyway here is the shadow stats numbers:

alt-cpi-home2.gif


I am just interested what they count so differently to get different numbers.

No one can duplicate his work and he doesn't explain his methodology. What it looks like to me is that he just tacks on an arbitrary percent to the CPI.
 
count energy and food. As gas goes up, no rocket science, so does the cost of process foods including field grown crops and orchards and of course dryland farming, manufactured goods and services..tnc.

But of course it includes food and energy.
 
Does anyone know about the metrics of john williams?

He ends up in vastly different numbers than the CPI. I think it has to do with hedonic adjustments but dont really know.

I cant really comment as I have no clue. But getting inflation number right is vital to getting other numbers right.

Anyway here is the shadow stats numbers:

alt-cpi-home2.gif


I am just interested what they count so differently to get different numbers.

No one can duplicate his work and he doesn't explain his methodology. What it looks like to me is that he just tacks on an arbitrary percent to the CPI.

That's exactly what he does.
He doesn't collect any data of his own.
He does collect plenty of money from his idiot subscribers.
 
As the price of oil goes up so does the cost of maintaining and building roads.
However the cost is a flat tax per gallon.
Gas tax should be a percentage of the price tax so it will pay for our road repairs and construction.

this is a conservative viewpoint.
Unless you want some other tax to pay for road repairs?

Gas tax should be a percentage of the price tax so it will pay for our road repairs and construction.

Or they could use the gas tax to repair the roads instead of using it to build bike paths.
 

Forum List

Back
Top