Confirmation of AGW

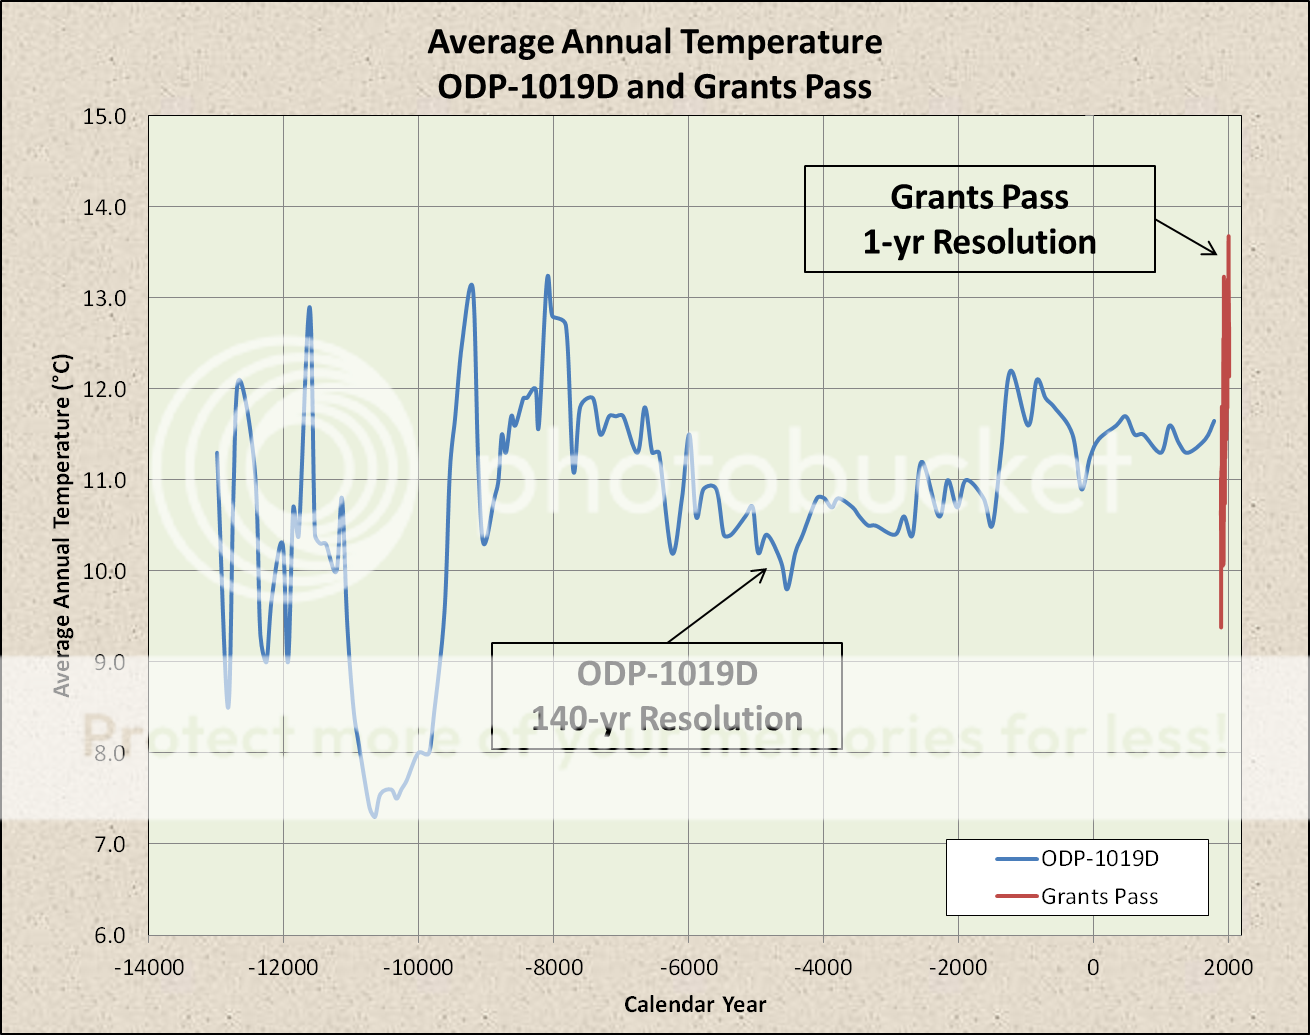
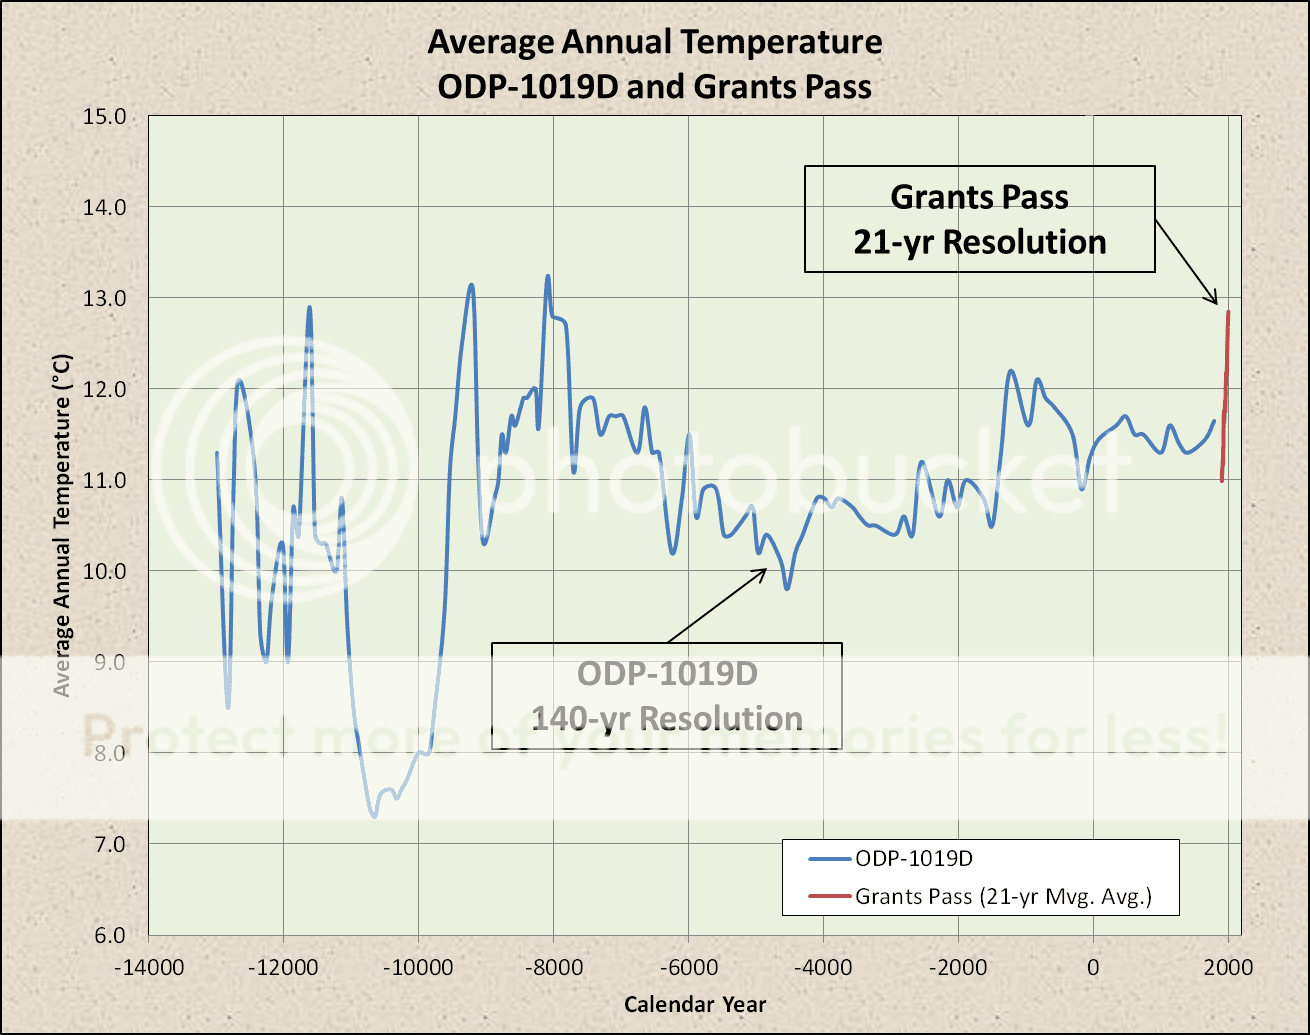
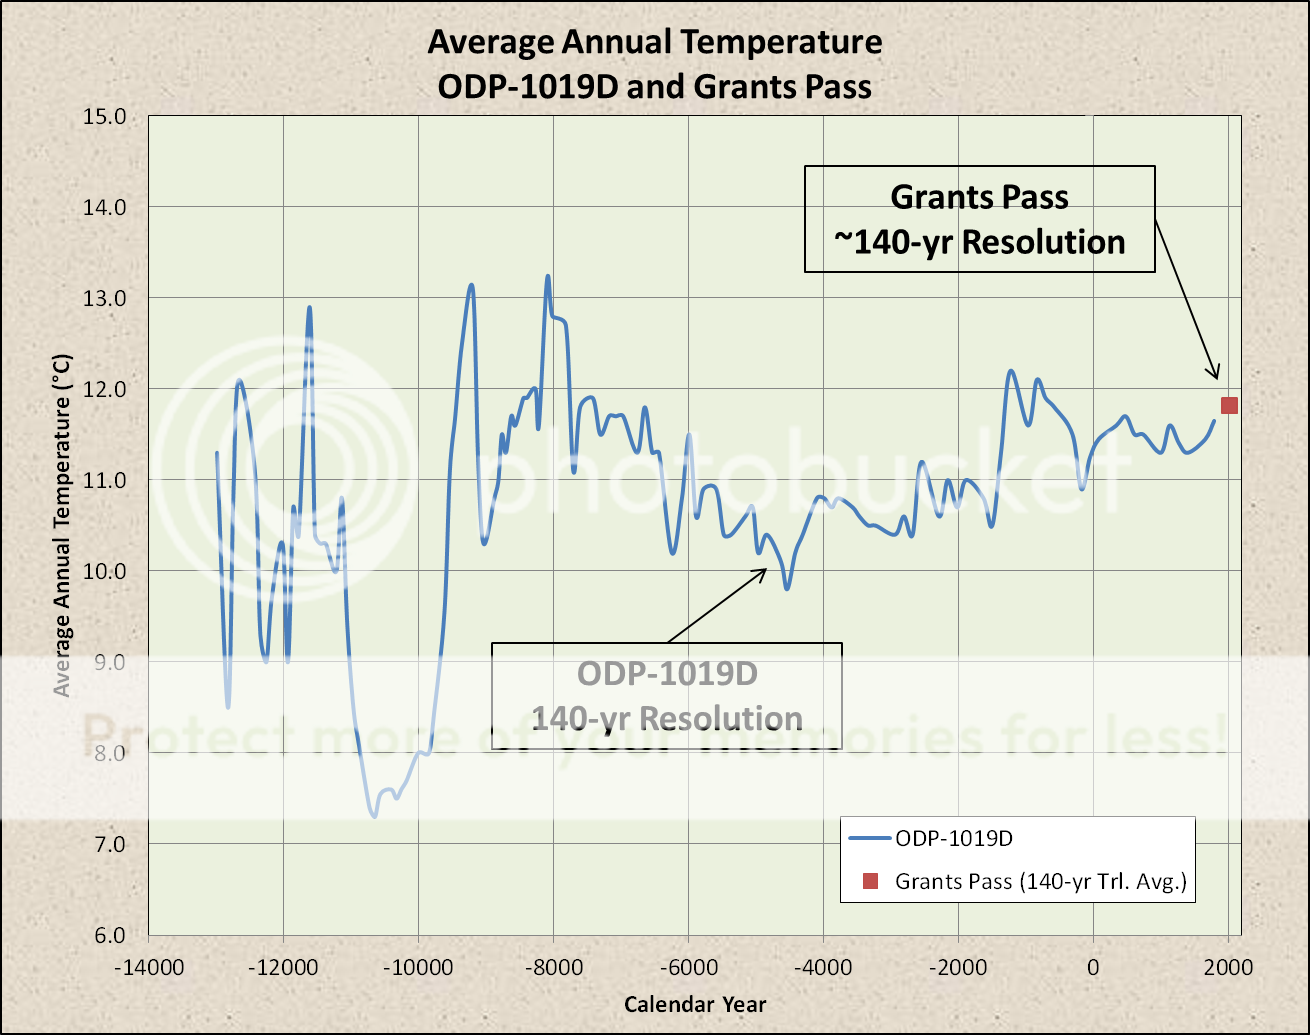
want another example of how Marcott's hockey stick is made by grafting a low resolution handle onto a high resolution blade? no? screw you Im going to anyways.

Marcott2_zpsbb1a108a.png


Marcott3_zps7738982b.png


Marcott4_zps8963077b.png


Marcott5_zpsd9e0833c.png


Marcott6_zps514231d3.png


A Simple Test of Marcott et al., 2013 | Watts Up With That?
 
Saigon- I posted up this graph awhile back but I dont remember your response.
akasofu_graph_little_ice-age%20copy.gif


I didnt realize it was from an actual paper. http://people.iarc.uaf.edu/~sakasofu/pdf/two_natural_components_recent_climate_change.pdf

not that I expect you to change your mind or anything like that but the paper is interesting because it interweaves a lot of information, quite a bit of it from the likes of Mann etc, into a very sensible and plausible alternate explanation to CO2 CAGW. you should look at it, if only for the info on glaciers.
 
Old Rocks- Steve McIntyre is back from family problems and Marcott2012 is firmly in his gaze. how long before it gets retracted?

Willis finally posted up all the proxy data. would you like to see it? hahahahahahaha
 
Uncomfirmable? Really? Care to explain your basis for that statement?

GIGO. If you cannot adaquetely defend your statement, then that term is applicable to your statements. And judgements of the validity of your future statements.

Can you show me a logged, calibrated thermometer reading (or group of readings) for each of those data points going back 400,000 years?

Nice answer, dumbkopf. The study went back 11,000 years. And used proxies. Have you the faintest idea what that means?

Yes, a proxy is a method of determining a value of some datapoint when direct measruement is impossible, such as trying to pinpoint temperature 11,300 years ago, when all our ancestors knew of weather was "hot, cold, raining." Various methods exist for this, but in the end they are really nothing more than derived data, where the method of derivation adds to the uncertainty of the data set.
 
thanks skooks. I knew Marcott2012 was bad from the start but now McIntyre has taken interest in disecting it. Marcott has already refused to clarify his methods, many of the proxies have failed the inclusion protocols, and the actual calculations seem to be unreplicable. shades of Mann and his hockey stick.

unfortunately it will probably still make it into the IPCC's AR5
 
Marcott et al 2013 has received lots of publicity, mainly because of its supposed vindication of the Stick. A number of commenters have observed that they are unable to figure out how Marcott got the Stick portion of his graph from his data set. Add me to that group.

The uptick occurs in the final plot-point of his graphic (1940) and is a singleton. I wrote to Marcott asking him for further details of how he actually obtained the uptick, noting that the enormous 1920-to-1940 uptick is not characteristic of the underlying data. Marcott’s response was unhelpful: instead of explaining how he got the result, Marcott stated that they had “clearly” stated that the 1890-on portion of their reconstruction was “not robust”. I agree that the 20th century portion of their reconstruction is “not robust”, but do not feel that merely describing the recent portion as “not robust” does full justice to the issues. Nor does it provide an explanation.


wow!! seems like an easy way to get through peer review. the only part of the paper that anyone gives a damn about is "not robust". but thats OK because it was admitted in the fine print.
 

Forum List

Back
Top