- Sep 12, 2008
- 14,201
- 3,567
- 185
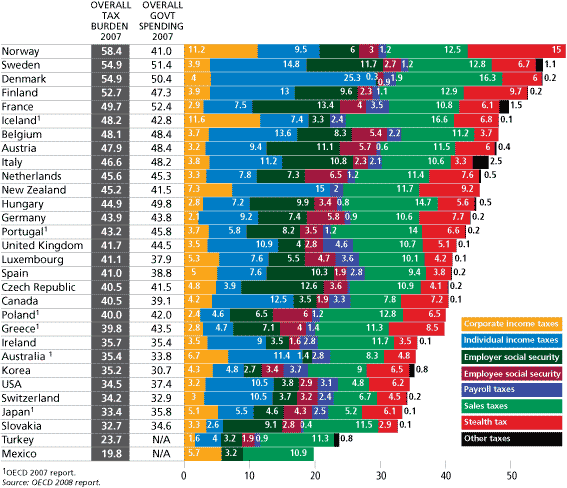
Every year Forbes publishes a tax misery index. It lists all the taxes the TOP marginal taxpayer would pay in each locale.
There are lots of surprises here. China is the state with the highest tax rate.
The US, for all the whining of us on the right, is actually pretty far down on the list. (though if we added in the cost of insurance, we might zoom way up...)
the weakest European states are pretty near the top. (Greece and Spain and Portugal) As are powerhouses like Norway and Sweden. Israel, for all its socialist talk, is way down near the middle. Communist Vietnam is lower yet, not a whole lot higher than tax rates in Texas, supposedly very business friendly. And Russia is a great deal lower than that.
Ireland is also in trouble, but it is pretty far down on the tax rates.
An interesting part of the tax picture is the geezer support taxes, which are huge in some places, like Ukraine, mexico, china, pretty much all of europe except Switzerland. In Asia, South Korea, Vietnam, and Japan all have low Geezer support taxes, but cultural mores mean this is shifted on to the citizens in a very large way. In Asia, four generation households are normal. All this cost is a real part of the expense of raising a family, so there is a huge tradeoff here that we don't see. The US has the lowest taxes to support the elderly in the west. Even the UAE, which has no other taxes, still has higher geezer taxes than the US. In most places, this tax falls on the employer, rather than on the worker. In the US, it is equally shared. Israel and the UAE are kind of weird in that the employee pays the larger share.
It is a cool chart.


