Colder Oceans May be the cause of increasing ice.

How does water of such massive proportions, as the Pacific and Atlantic Oceans, lose heat?

If it is going to be losing heat, does it drop uniformly throughout the entire depth of the Oceans? Or, does heat loss come about through other mechanical means?

For example, does heat rise through the various depths and layers of the oceans, temporarily increasing the "layers" closer to the surface? Then as the heat loss continues, is it reasonable to expect that the surface areas will stop gaining the heat which is being lost from the lower depths? At some point, can we expect to see the surface temperatures dropping too? How long would that process take?

Or is the cooling of the Oceans accomplished by other mechanical means?

Here is one place to start getting answers to your questions.

El Niño-Southern Oscillation - Wikipedia, the free encyclopedia

El Niño-Southern Oscillation is a periodic change in the atmosphere and ocean of the tropical Pacific region. It is defined in the atmosphere by the sign of the pressure difference between Tahiti and Darwin, Australia, and in the ocean by warming or cooling of surface waters of the tropical central and eastern Pacific Ocean. El Niño is the warm phase of the oscillation and La Niña is the the cold phase.[2] The oscillation does not have a specific period, but occurs every three to eight years. Mechanisms that cause the oscillation remain a matter of research.

The El Niño-Southern Oscillation is often abbreviated as ENSO and in popular usage is commonly called simply El Niño. El Niño is Spanish for "the boy" and refers to the Christ child, because periodic warming in the Pacific near South America is usually noticed around Christmas.[3] "La Niña," is Spanish for "the girl."

Effects on weather vary with each event, but ENSO is associated with floods, droughts and other weather disturbances in many regions of the world. In the Atlantic Ocean, effects lag behind those in the Pacific by 12 to 18 months. Developing countries dependent upon agriculture and fishing, particularly bordering the Pacific ocean, are especially affected.

And here is an even better place;
ENSO Page


ENSO Simulation: GFDL Global Climate Model

Results from a comprehensive ocean/atmosphere/land/ice model running at NOAA's Geophysical Fluid Dynamics Laboratory in Princeton, New Jersey. The image at right shows upper-ocean temperature anomalies at the peak of an El Niño event, with red indicating 1°C or more above normal, blue 1°C or more below normal. The animation shows how the simulated temperatures evolve slowly from cold to warm, and then back to cold, over the course of 5 years. Oceanic changes associated with El Niño affect ocean ecosystems and global weather patterns, with far-reaching impacts on fisheries, agriculture, and natural disasters (worldwide losses resulting from the 1997-98 El Niño are estimated at $32-$96 billion). Accurate predictions of these events could potentially reduce these costs to society. Click here for more on climate forecasting at GFDL.
 
Since I am about five years older than Al Gore, are you saying that he has also invented time travel?

David, I presented data, if you have data that says differant, then present it.
 
How does water of such massive proportions, as the Pacific and Atlantic Oceans, lose heat?

If it is going to be losing heat, does it drop uniformly throughout the entire depth of the Oceans? Or, does heat loss come about through other mechanical means?

For example, does heat rise through the various depths and layers of the oceans, temporarily increasing the "layers" closer to the surface? Then as the heat loss continues, is it reasonable to expect that the surface areas will stop gaining the heat which is being lost from the lower depths? At some point, can we expect to see the surface temperatures dropping too? How long would that process take?

Or is the cooling of the Oceans accomplished by other mechanical means?
Pacific Decadal Oscillation (PDO) Index – Back into the Negative « Digital Diatribes
Quiet sun → reduced magnetic and thermal flux = reduced solar wind → geomagnetic shield drops → galactic cosmic ray flux → more low-level clouds and more snow → more albedo effect (more heat reflected) → colder climate

Active sun → enhanced magnetic and thermal flux = solar wind → geomagnetic shield response → less low-level clouds → less albedo (less heat reflected) → warmer climate
 
How does water of such massive proportions, as the Pacific and Atlantic Oceans, lose heat?

If it is going to be losing heat, does it drop uniformly throughout the entire depth of the Oceans? Or, does heat loss come about through other mechanical means?

For example, does heat rise through the various depths and layers of the oceans, temporarily increasing the "layers" closer to the surface? Then as the heat loss continues, is it reasonable to expect that the surface areas will stop gaining the heat which is being lost from the lower depths? At some point, can we expect to see the surface temperatures dropping too? How long would that process take?

Or is the cooling of the Oceans accomplished by other mechanical means?


The long answer will never end. The short answer is that the experts are just now discovering that what they don't know is far greater than what they do know.

The prevailing wisdom of the middle to end of the 20th century was that the oceans were warming and doing so at an alarming rate. To prove and measure this, the Argos Array of Sea Buoys was deployed. The resulting actual real data shot a hole with a 2 foot exit wound in that wisdom.

Turns out that the temp of the oceans vascilates within an annual cycle and it has been cooling recently. Go Figure.

Global Change Analysis
 
How does water of such massive proportions, as the Pacific and Atlantic Oceans, lose heat?

If it is going to be losing heat, does it drop uniformly throughout the entire depth of the Oceans? Or, does heat loss come about through other mechanical means?

For example, does heat rise through the various depths and layers of the oceans, temporarily increasing the "layers" closer to the surface? Then as the heat loss continues, is it reasonable to expect that the surface areas will stop gaining the heat which is being lost from the lower depths? At some point, can we expect to see the surface temperatures dropping too? How long would that process take?

Or is the cooling of the Oceans accomplished by other mechanical means?


The long answer will never end. The short answer is that the experts are just now discovering that what they don't know is far greater than what they do know.

The prevailing wisdom of the middle to end of the 20th century was that the oceans were warming and doing so at an alarming rate. To prove and measure this, the Argos Array of Sea Buoys was deployed. The resulting actual real data shot a hole with a 2 foot exit wound in that wisdom.

Turns out that the temp of the oceans vascilates within an annual cycle and it has been cooling recently. Go Figure.

Global Change Analysis

Code, did you even bother to read this site? For God's sake, the second graph on the site shows a very strong warming continueing right up to today. In fact, the paragraph preceding the graph states in no uncertain tersm that the ocean is continueing to gain heat at an alarming rate.

Global Change Analysis

Ocean temperature and heat content
Over the past 50 years, the oceans have absorbed more than 80% of the total heat added to the air/sea/land/cyrosphere climate system (Levitus et al, 2005). As the dominant reservoir for heat, the oceans are critical for measuring the radiation imbalance of the planet and the surface layer of the oceans plays the role of thermostat and heat source/sink for the lower atmosphere.

Domingues et al (2008) and Levitus et al (2009) have recently estimated the multi-decadal upper ocean heat content using best-known corrections to systematic errors in the fall rate of expendable bathythermographs (Wijffels et al, 2008). For the upper 700m, the increase in heat content was 16 x 1022 J since 1961. This is consistent with the comparison by Roemmich and Gilson (2009) of Argo data with the global temperature time-series of Levitus et al (2005), finding a warming of the 0 - 2000 m ocean by 0.06°C since the (pre-XBT) early 1960's.
what's the matter rockhead? Did Chris wreck your asshole again last night?
 
How does water of such massive proportions, as the Pacific and Atlantic Oceans, lose heat?

If it is going to be losing heat, does it drop uniformly throughout the entire depth of the Oceans? Or, does heat loss come about through other mechanical means?

For example, does heat rise through the various depths and layers of the oceans, temporarily increasing the "layers" closer to the surface? Then as the heat loss continues, is it reasonable to expect that the surface areas will stop gaining the heat which is being lost from the lower depths? At some point, can we expect to see the surface temperatures dropping too? How long would that process take?

Or is the cooling of the Oceans accomplished by other mechanical means?


The long answer will never end. The short answer is that the experts are just now discovering that what they don't know is far greater than what they do know.

The prevailing wisdom of the middle to end of the 20th century was that the oceans were warming and doing so at an alarming rate. To prove and measure this, the Argos Array of Sea Buoys was deployed. The resulting actual real data shot a hole with a 2 foot exit wound in that wisdom.

Turns out that the temp of the oceans vascilates within an annual cycle and it has been cooling recently. Go Figure.

Global Change Analysis

Code, did you even bother to read this site? For God's sake, the second graph on the site shows a very strong warming continueing right up to today. In fact, the paragraph preceding the graph states in no uncertain tersm that the ocean is continueing to gain heat at an alarming rate.

Global Change Analysis

Ocean temperature and heat content
Over the past 50 years, the oceans have absorbed more than 80% of the total heat added to the air/sea/land/cyrosphere climate system (Levitus et al, 2005). As the dominant reservoir for heat, the oceans are critical for measuring the radiation imbalance of the planet and the surface layer of the oceans plays the role of thermostat and heat source/sink for the lower atmosphere.

Domingues et al (2008) and Levitus et al (2009) have recently estimated the multi-decadal upper ocean heat content using best-known corrections to systematic errors in the fall rate of expendable bathythermographs (Wijffels et al, 2008). For the upper 700m, the increase in heat content was 16 x 1022 J since 1961. This is consistent with the comparison by Roemmich and Gilson (2009) of Argo data with the global temperature time-series of Levitus et al (2005), finding a warming of the 0 - 2000 m ocean by 0.06°C since the (pre-XBT) early 1960's.


I think we've talked about this before.

Prior to the start of the deployment of the array, most of the data from the oceans was collected in an informal ad hoc manner with anecdotal information carrying as much weight as scientific data. The data was less plentiful than the finger in the wind information.

Any "multi-decadenal" data incorporates this "data". The newly deployed array collects and submits data regularly from various depths and more than 3000 buoy continuously circulating around the world's oceans.

Any prior data is worthless as it is both incomplete and wildly dependant on a level of collection just this side of conjecture.

Data from the array, certainly very short term, reflects cooling which is exactly what I said.

Why is it that the more technical the data collection becomes, like that from RSS, UAH, Hadcrut and Argos, the less respected it is in the world of AGW?
 
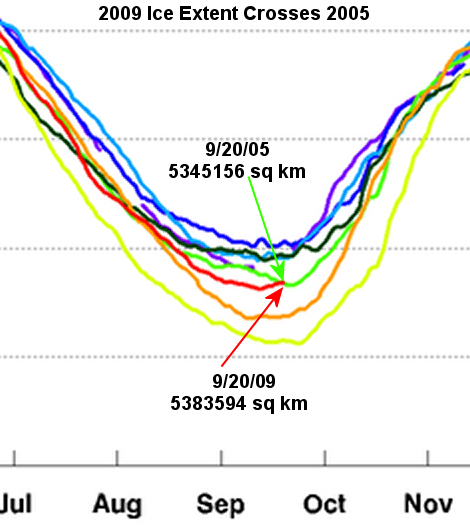
2009 Arctic Sea Ice Extent exceeds 2005 for this date « Watts Up With That?

jaxa_2009-crosses-2005.png


While 2009 minimum on 09/13 of 5,249, 844 was just 65, 312 sq km below 2005 in minimum extent, which occurred on 9/22/2005 with 5,315,156 sq km, it has now rebounded quickly and is higher by 38,438 sq km, just 2 days before the 9/22/05 minimum. On 9/22/2009 it may very well be close to 60-80,000 sq km higher than the minimum on the same date in 2005.

While by itself this event isn’t all that significant, it does illustrate the continued rebound for the second year. The fact that we only missed the 2005 minimum by 65, 312, which is about one days worth of melt during many days of the melt season is also noteworthy
 
we need to be collecting all that fresh water from the glaciers/ icecaps that is melting before it all goes in to the salty ocean....we could really use the fresh water, plus we don't want the oceans conveyor belt to stop, then a mini ice age will come...or a major one?
 
The world's ocean surface temperature was the warmest on record for July, breaking the previous record set in 1998, reports NOAA's National Climatic Data Center. At 62.56°F (16.99°C), ocean temperatures were 1.06°F (0.59°C) above the 20th century average.

The combined average global land and ocean surface temperature for July 2009 (61.43°F - 16.37°C) ranked as the fifth-warmest since recordkeeping began in 1880.

Record global ocean temperature in July

Was it the warmest or the 5th warmest? I'm as confused by your posts as the scientests are as to if it is global warming/cooling that is natural or affected by man.

Really. Read it more carefully.
 
The world's ocean surface temperature was the warmest on record for July, breaking the previous record set in 1998, reports NOAA's National Climatic Data Center. At 62.56°F (16.99°C), ocean temperatures were 1.06°F (0.59°C) above the 20th century average.

The combined average global land and ocean surface temperature for July 2009 (61.43°F - 16.37°C) ranked as the fifth-warmest since recordkeeping began in 1880.

Record global ocean temperature in July

Was it the warmest or the 5th warmest? I'm as confused by your posts as the scientists are as to if it is global warming/cooling that is natural or affected by man.

Really. Read it more carefully.

I am you say "The world's ocean surface temperature was the warmest on record for July.........The combined average global land and ocean surface temperature for July 2009 (61.43°F - 16.37°C) ranked as the fifth-warmest"

So is it the warmest on record or the 5th warmest on record?

Like I said your post is as confused as the scientists. Half say global warming is caused by man the other half says man has a negligible impact.
 
A much more detailed graph by real scientists is available right here;

NSIDC Press Room: 2009 Arctic sea ice minimum

As you can see, at present the ice is below the 2005 level. And it is still more than two deviation points below the twenty year average.


And it shows the 2009 at present still below 2005

Man the climate debate is so far from an exact science. I saw your graphs then found this information after

antarctic_sea_ice_march_1980_verses_march_2009.jpg


AMSRE_Sea_Ice_Extent.png


The one above shows that after a record melt in 07 they have been melting less and less.


ALASKA’S ICE THICKENS OVER UNUSUAL SUMMER
http://www.telegraph.co.uk/comment/...e-elements-conspire-against-the-warmists.html
Revealed: Antarctic ice growing, not shrinking | The Australian
 
Was it the warmest or the 5th warmest? I'm as confused by your posts as the scientists are as to if it is global warming/cooling that is natural or affected by man.

Really. Read it more carefully.

I am you say "The world's ocean surface temperature was the warmest on record for July.........The combined average global land and ocean surface temperature for July 2009 (61.43°F - 16.37°C) ranked as the fifth-warmest"

So is it the warmest on record or the 5th warmest on record?

Like I said your post is as confused as the scientists. Half say global warming is caused by man the other half says man has a negligible impact.
there are 2 different data sets there
one is just ocean temps, the other is a combined ocean and land temps
 
After two hundred years of steady ice loss we have one summer of increase. Well, that is a good thing, but hardly creates a trend.


Alaska’s ice thickens over unusual summer
By Climatologist Cliff Harris
__________________


9 Jun 09 – “Two hundred years of glacial shrinkage in Alaska, and then came the winter and summer of 2007-2008.

Unusually large amounts of winter snow were followed by abnormally chilly temperatures in June, July and August.

"In mid-June, I was surprised to see snow still at sea level in Prince William Sound," said U.S. Geological Survey glaciologist Bruce Molnia. "On the Juneau Icefield, there was still 20 feet of new snow on the surface of the Taku Glacier in late July. At Bering Glacier, a landslide I am studying, located at about 1,500 feet elevation, did not become snow free until early August.

"In general, the weather this summer was the worst I have seen in at least 20 years."

Never before in the history of a research project dating back to 1946 had the Juneau Icefield witnessed the kind of snow buildup that came this year. It was similar on a lot of other glaciers too.

"It's been a long time on most glaciers where they've actually had positive mass balance," Molnia said.

That's the way a scientist says the glaciers got thicker in the
middle. The same thickening of the ice in the middle of the
continent is also happening in Antarctica. (Added by Cliff Harris.)

See entire article:
ALASKA’S ICE THICKENS OVER UNUSUAL SUMMER
Thanks to meteorologist Randy Mann for this link
 
If you look at the graphs on the sea ice on this site, you will see a major loss of sea ice in the Arctic, and a minor increase in sea ice in the Antarctic. However, as measured by the Grace satellites, both Greenland and the Antarctic continent are losing ice.

SOTC: Sea Ice
 

Forum List

Back
Top